GBP/JPY Elliott Wave technical analysis [Video]
![GBP/JPY Elliott Wave technical analysis [Video]](https://editorial.fxstreet.com/images/Markets/Currencies/Crosses/GBPJPY/iStock-1151541926_XtraLarge.jpg)
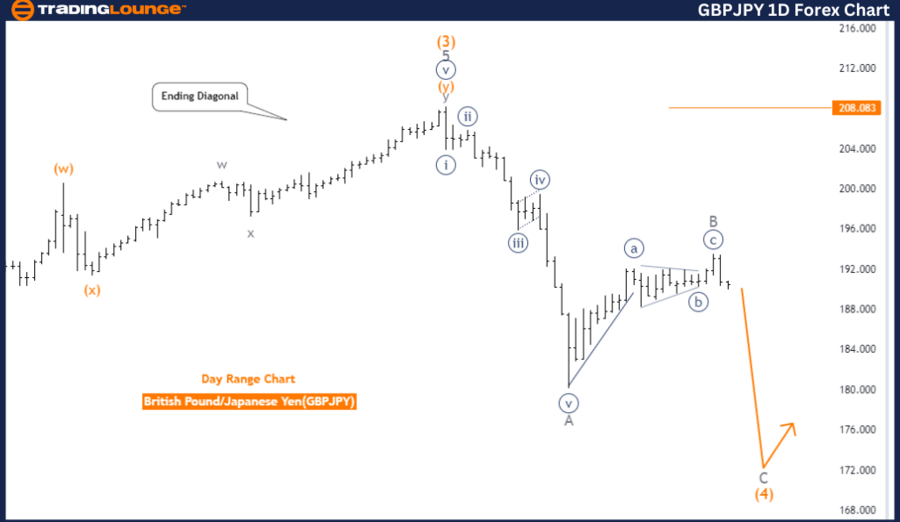
GBP/JPY Elliott Wave technical analysis
-
Function: Counter Trend.
-
Mode: Impulsive as C.
-
Structure: Gray Wave C.
-
Position: Orange Wave 4.
-
Direction (next higher degrees): Orange Wave 5.
-
Details: Gray Wave B of 4 appears completed, and now Gray Wave C of 4 is in play.
-
Wave cancel invalidation level: 208.083.
Analysis overview
The GBPJPY Day Chart has been analyzed using Elliott Wave theory, highlighting that the market is currently in a counter-trend phase. The mode is impulsive as C, suggesting that the market is undergoing a strong corrective movement in the opposite direction of the previous trend. The identified wave structure is Gray Wave C, positioned within Orange Wave 4.
The analysis indicates that Gray Wave B of Wave 4 has likely completed, allowing Gray Wave C of Wave 4 to begin forming. This wave structure is an essential part of the ongoing corrective phase within the broader Elliott Wave sequence. As the market progresses through Gray Wave C, it could eventually lead to the formation of Orange Wave 5, marking the next significant movement in the sequence.
Wave structure insights
The focus of the analysis is on how Gray Wave C evolves, as it will provide important insights into the future direction of the market within the corrective structure. The progression of this wave is expected to continue until the structure reaches completion or encounters invalidation.
Critical level to watch
A key point to observe is the wave cancellation invalidation level, set at 208.083. If the market reaches or exceeds this level, the current Elliott Wave count would be invalidated, indicating that the expected wave structure is no longer applicable. Until this threshold is breached, the current wave count remains in effect, with the market likely continuing within the ongoing corrective phase.
Summary
In conclusion, the GBPJPY Day Chart reflects a counter-trend phase characterized by an impulsive wave structure, Gray Wave C. This wave is now active following the completion of Gray Wave B, positioned within Orange Wave 4. The wave cancellation invalidation level is 208.083, acting as a crucial marker for maintaining the current Elliott Wave count.
GBP/JPY day chart
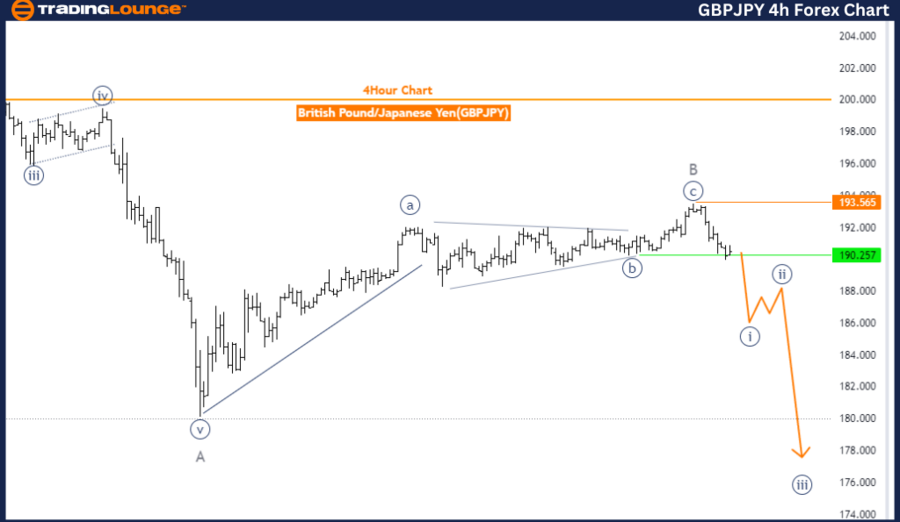
GBP/JPY Elliott Wave technical analysis
-
Function: Counter Trend.
-
Mode: Impulsive.
-
Structure: Navy Blue Wave 1.
-
Position: Gray Wave C.
-
Direction (next higher degrees): Navy Blue Wave 2.
-
Details: Gray Wave B of 4 appears complete, and now Navy Blue Wave 1 of Gray Wave C of 4 is in play.
-
Wave cancel invalidation level: 193.565.
Analysis overview
The GBPJPY 4-hour chart has been analyzed through the lens of Elliott Wave theory. The current market movement is categorized as a counter-trend phase. The mode is impulsive, signifying a strong directional push within this corrective phase. The ongoing wave structure is Navy Blue Wave 1, situated within the broader Gray Wave C.
The analysis suggests that Gray Wave B of Wave 4 is likely completed, paving the way for the formation of Navy Blue Wave 1 within Gray Wave C of Wave 4. This development plays a crucial role in the current corrective phase and is key to understanding the larger market trend.
Wave structure insights
Navy Blue Wave 1's position within Gray Wave C signifies that the market is still in the early phase of this new wave structure. This progression is essential for assessing the future market direction, as further movements in line with the corrective trend are expected.
Critical level to watch
A pivotal point to monitor is the wave cancellation invalidation level at 193.565. Should the market hit or exceed this level, it would invalidate the current Elliott Wave count. In such a case, the anticipated wave structure would no longer be valid, and a reassessment of the chart would be necessary. Until this level is breached, the current wave count remains in effect, and the market is expected to continue within this corrective movement.
Summary
In conclusion, the GBPJPY 4-hour chart indicates a counter-trend movement within an impulsive mode. The wave structure is evolving within Navy Blue Wave 1 of Gray Wave C, following the completion of Gray Wave B. The key wave cancellation invalidation level is 193.565, which acts as a critical indicator for maintaining the validity of the current Elliott Wave count.
GBP/JPY four-hour chart
GBP/JPY Elliott Wave technical analysis [Video]
Author

Peter Mathers
TradingLounge
Peter Mathers started actively trading in 1982. He began his career at Hoei and Shoin, a Japanese futures trading company.


