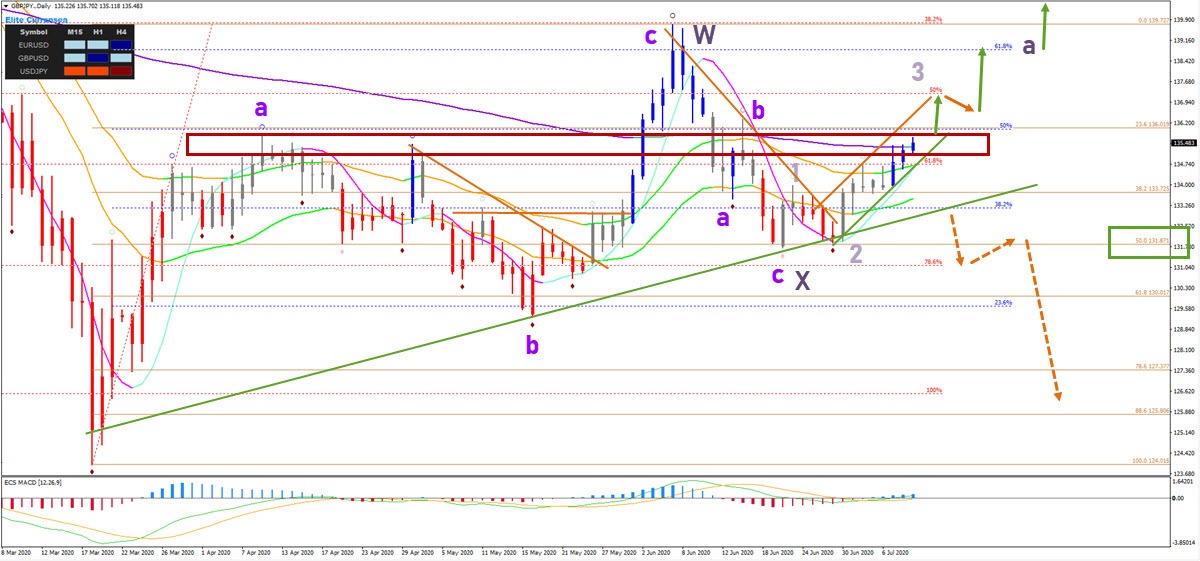
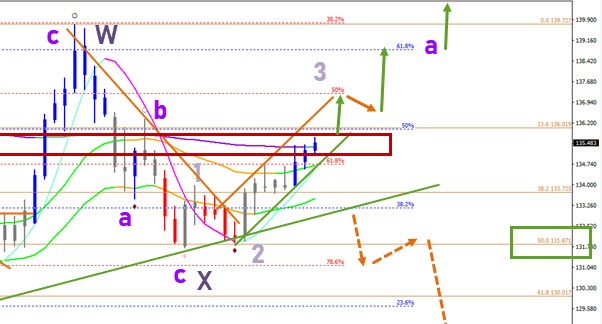
GBP/JPY daily chart testing key 144 ema plus HS

GBP/JPY is testing the 144 ema resistance (red box) after bouncing at the 50% Fibonacci support zone (green box). A bullish breakout could confirm a move higher.
The GBP/JPY is testing the 144 ema resistance (red box) after bouncing at the 50% Fibonacci support zone (green box). A bullish breakout could confirm a move higher.
Daily chart
The GBP/JPY might be building a wave 3 (light purple) but there needs to be a clear daily candle closing above the resistance zone and 144 ema close. A breakout could trigger a wave 3 (light purple) of wave A (purple) that will retest the previous top.
A failure for price to break the head and shoulders pattern resistance level could trigger a retest of the support (green) trend line. A bearish breakout below that support line could turn the table and indicate a bearish outlook towards the next Fibonacci levels.
The analysis has been done with the ecs.SWAT method and ebook.
Author

Chris Svorcik
Elite CurrenSea
Experience Chris Svorcik has co-founded Elite CurrenSea in 2014 together with Nenad Kerkez, aka Tarantula FX. Chris is a technical analyst, wave analyst, trader, writer, educator, webinar speaker, and seminar speaker of the financial markets.


