GBP/AUD Elliott Wave technical analysis [Video]
![GBP/AUD Elliott Wave technical analysis [Video]](https://editorial.fxstreet.com/images/Markets/Currencies/coins-of-different-currencies-29548070.jpg)
GBPAUD Elliott Wave Analysis Trading Lounge.
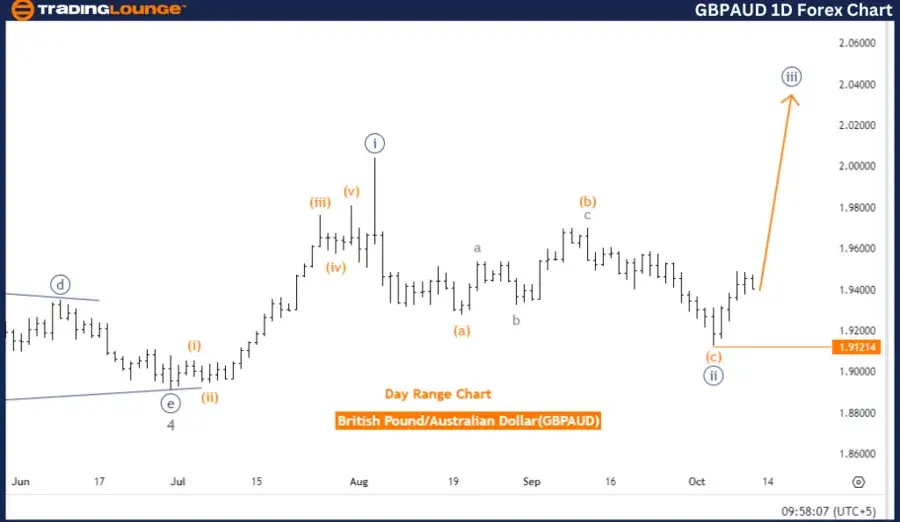
British Pound/Australian Dollar (GBPAUD) Day Chart.
GBP/AUD Elliott Wave technical analysis
Function: Bullish Trend.
Mode: Impulsive.
Structure: Navy Blue Wave 3.
Position: Gray Wave 5.
Direction next higher degrees: Navy Blue Wave 3 (started).
Details: Navy Blue Wave 2 appears to be complete, with Navy Blue Wave 3 now underway.
Wave cancel invalid level: 1.91214.
The GBPAUD Elliott Wave analysis on the daily chart highlights a bullish trend in an impulsive phase. The current structure shows that the market is in navy blue wave 3, following the completion of Navy Blue Wave 2. This indicates that the upward trend is ongoing, with the third wave actively advancing.
The market’s position is within gray wave 5, representing the final stage of the wave structure at this level. With the completion of navy blue wave 2, the market is moving forward in Navy Blue Wave 3, typically a strong bullish phase in the Elliott Wave sequence.
The direction at the next higher degrees suggests that navy blue wave 3 has already begun, and the ongoing wave progression is likely to drive the market higher within this bullish structure. As long as the price adheres to the Elliott Wave framework, the bullish trend is expected to persist.
The wave cancellation invalidation level is set at 1.91214. Should the price fall below this level, the current wave count would be considered invalid, potentially signaling a shift in the wave structure or a risk to the upward momentum.
Summary:
The GBPAUD is currently in a bullish trend within the impulsive navy blue wave 3. The completion of navy blue wave 2 has triggered a strong upward movement, with gray wave 5 in progress. The market is expected to maintain its position within the Elliott Wave structure as long as it stays above the invalidation level of 1.91214.
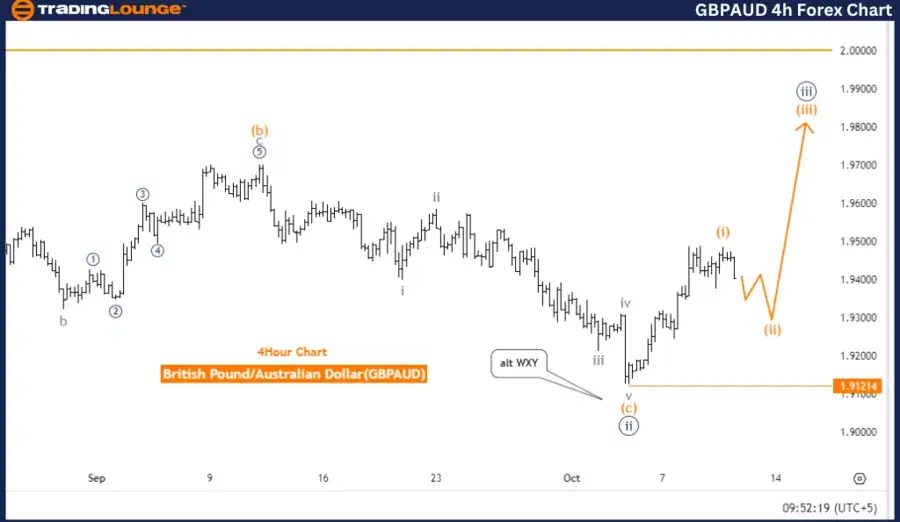
British Pound/Australian Dollar (GBPAUD) 4 Hour Chart.
GBP/AUD Elliott Wave technical analysis
Function: Counter Trend.
Mode: Corrective.
Structure: Orange Wave 2.
Position: Navy Blue Wave 3.
Direction next higher degrees: Orange Wave 3.
Details: Orange wave 1 appears to be complete, with orange wave 2 now unfolding.
Wave cancel invalid level: 1.91214.
The GBPAUD Elliott Wave analysis on the 4-hour chart points to a counter-trend movement currently in a corrective phase. The structure indicates the market is in orange wave 2, following the completion of orange wave 1. This suggests the market is undergoing a correction after the initial wave of the downward trend.
Currently, the market is positioned in navy blue wave 3, which is part of the larger orange wave 2. As orange wave 2 continues, it is expected to transition into orange wave 3, signaling the resumption of the downtrend once the corrective phase concludes. Orange wave 1 has been completed, marking the start of the trend, and orange wave 2 is now correcting within this larger structure.
The next higher degrees suggest that after orange wave 2 completes, the market will move into orange wave 3, continuing the overall downtrend. The invalidation level for this wave structure is 1.91214. If the price exceeds this level, the current Elliott Wave count would be invalidated, implying that the corrective phase may have ended.
Summary:
The GBPAUD is in a counter-trend corrective phase with orange wave 2 in progress following the completion of orange wave 1. After this correction, the market is expected to continue its downtrend in orange wave 3. The wave structure remains valid as long as the price stays below the invalidation level of 1.91214.
Technical analyst: Malik Awais.
GBP/AUD Elliott Wave technical analysis [Video]
Author

Peter Mathers
TradingLounge
Peter Mathers started actively trading in 1982. He began his career at Hoei and Shoin, a Japanese futures trading company.


