Friday's Bounce, Trend Change?

Stocks were retracing some of their recent sell-off on Friday, as investors' sentiment slightly improved following the quarterly corporate earnings releases, among other factors. The S&P 500 index bounced off its long-term upward trend line. But is this an upward reversal or just quick a dead-cat-bounce correction before another leg down?
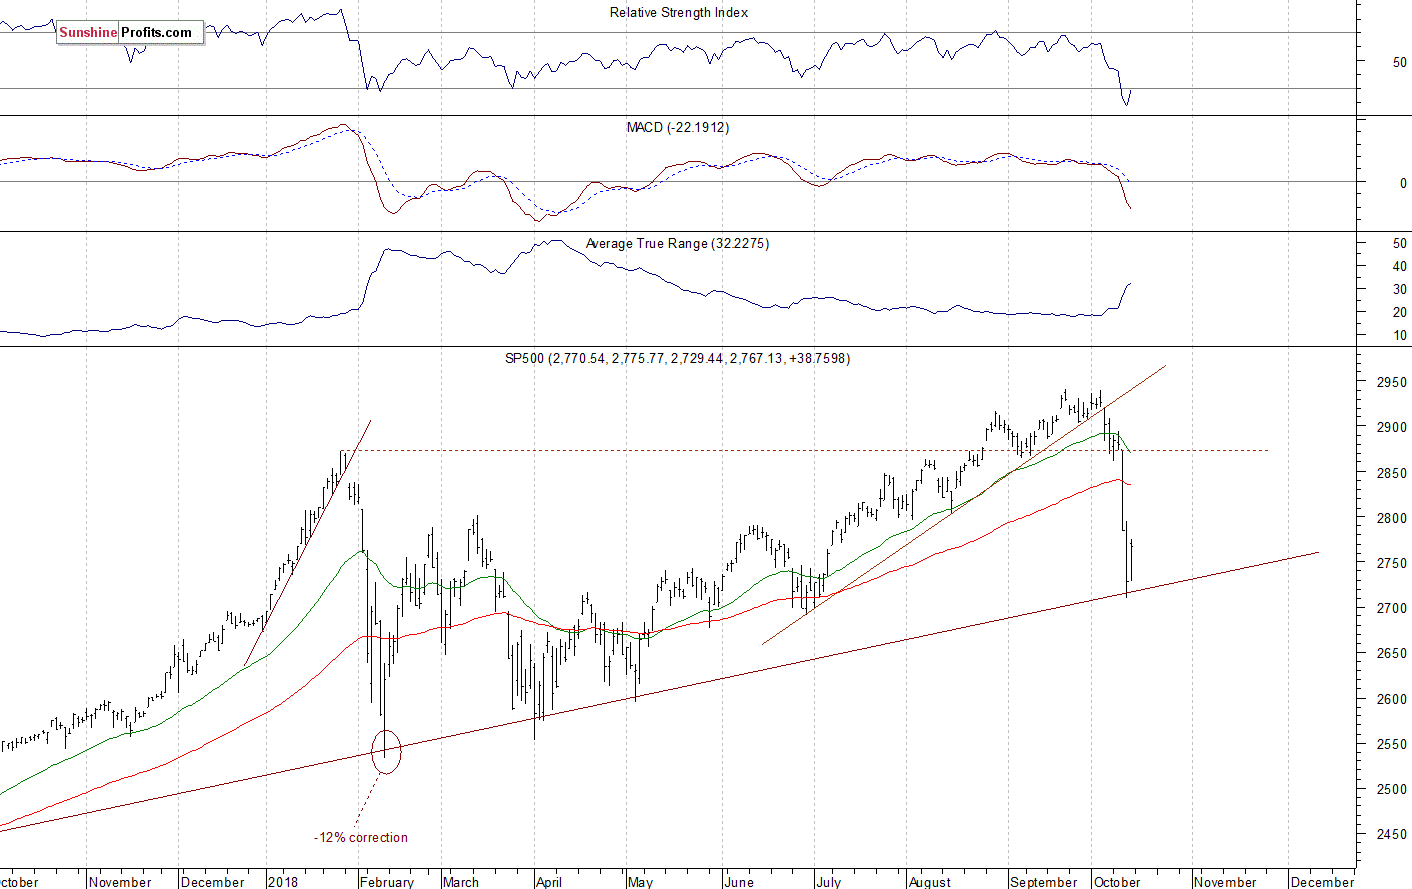
The U.S. stock market indexes gained 1.2-2.3% on Friday, retracing some of their recent decline, as investors' sentiment improved. The S&P 500 index continues to trade above its long-term upward trend line. It is currently 5.9% below September the 21st record high of 2,940.91. The Dow Jones Industrial Average gained 1.2% and the Nasdaq Composite gained 2.3% on Friday.
The nearest important level of resistance of the S&P 500 index is now at around 2,770, marked by the recent level of support and Friday's local high. The resistance level is also at 2,800. On the other hand, the level of support is now at 2,700-2,730, marked by the recent local lows and the long-term upward trend line. The support level is also at 2,630-2,650.
The broad stock market continued retracing its medium-term advance last week, as it got closer to 2,700 mark. Then they bounced on Friday, retracing some of their Thursday's decline. If the index breaks above the resistance level of around 2,800, we could see more buying pressure. But for now it looks like a relatively small upward correction within a downtrend:
Short-term Fluctuations
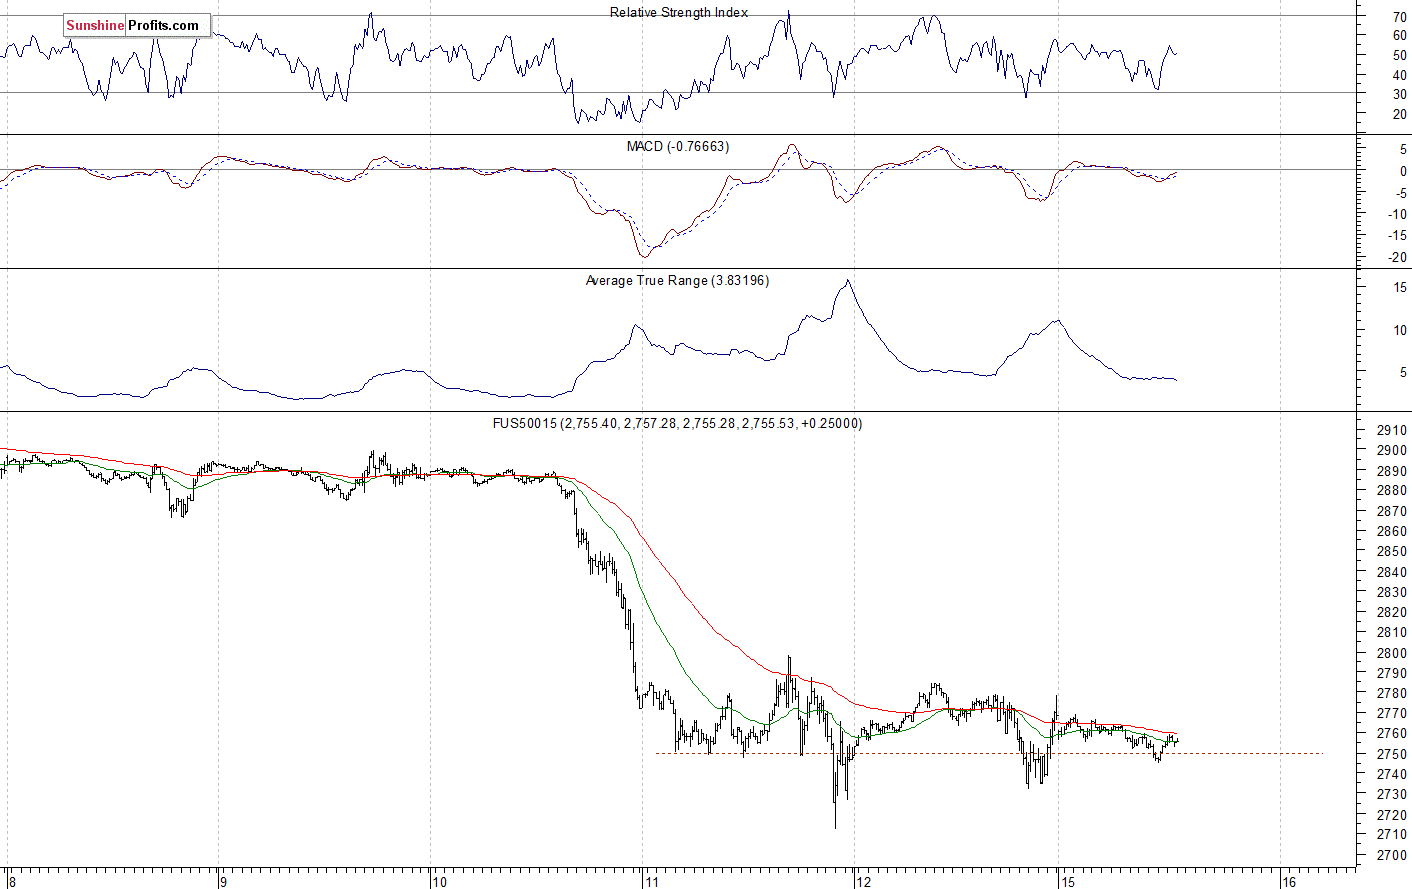
The index futures contracts trade 0.4-0.9% below their Friday's closing prices. So expectations before the opening of today's trading session are negative. The European stock market indexes have been mixed so far. Investors will wait for some economic data announcements today: Retail Sales, Empire State Manufacturing number at 8:30 a.m., Business Inventories at 10:00 a.m. The broad stock market will probably retrace some of its Friday's advance this morning. But will the downtrend continue below Thursday's intraday low today? Probably not. We could see some more volatile fluctuations following the recent sell-off. We can still see some short-term oversold conditions.
The S&P 500 futures contract trades within an intraday consolidation. The nearest important level of resistance is at around 2,770-2,800, marked by the short-term local highs. The resistance level is also at 2,820-2,830. On the other hand, the support level is at 2,730-2,740, marked by the local lows. The next level of support is at 2,700-2,720. The futures contract remains close to 2,750 mark, as we can see on the 15-minute chart:
Nasdaq Goes Sideways
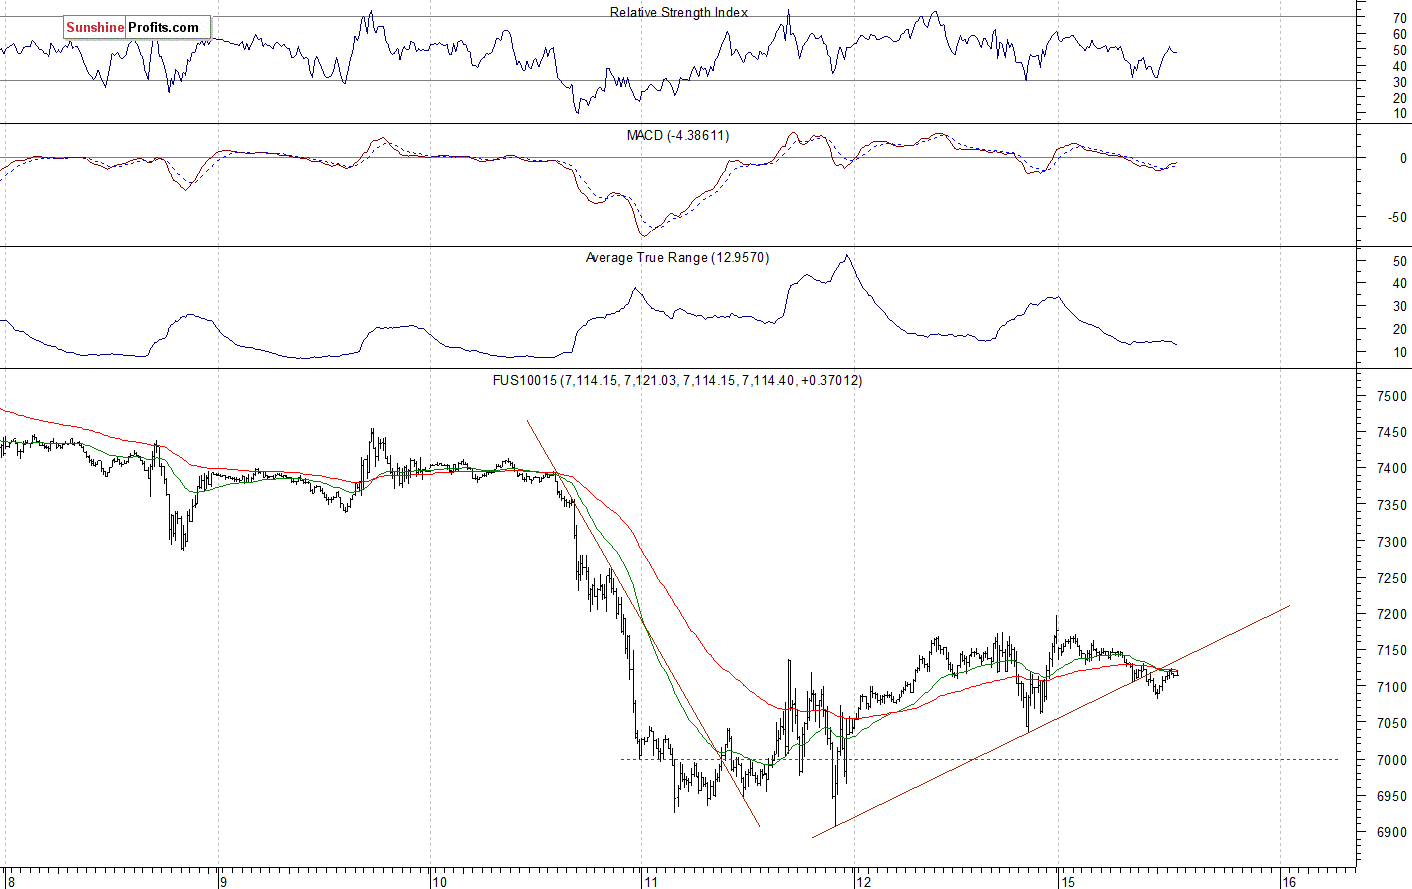
The technology Nasdaq 100 futures contract follows a similar path, as it trades within an intraday consolidation this morning. The tech stocks' gauge broke below 7,000 mark recently, and it traded closer to the level of 6,900 on Thursday. So it fell over 800 points off its October the 1st record high above the level of 7,700. The nearest important support level is now at around 6,900-7,000, marked by the recent fluctuations. On the other hand, the resistance level is now at 7,200-7,250, among others. The Nasdaq futures contract trades slightly below its short-term upward trend line, as the 15-minute chart shows:
Apple, Amazon - Mixed Picture
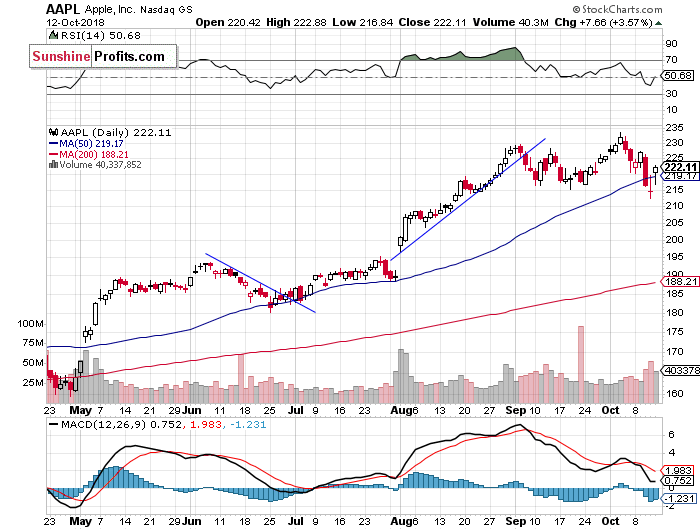
Let's take a look at Apple, Inc. stock (AAPL) daily chart (chart courtesy of http://stockcharts.com). It reached the new record high at the level of $233.47 in the early October, as it continued to act relatively strong. Then the stock retraced most of its recent rally. Last week's Tuesday's trading session was pretty bullish, as the price bounced off the support level. But then it sold off on Wednesday, as it got close to the support level of around $215 again. The stock still seems relatively stronger than the broad stock market, following Friday's rebound:
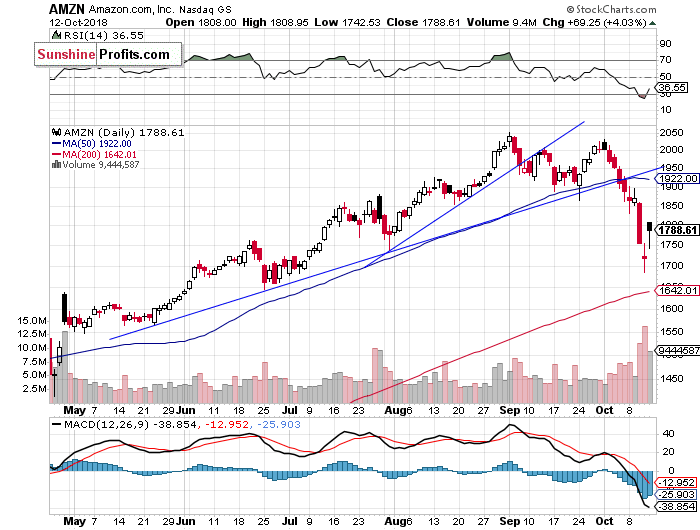
Now let's take a look at Amazon.com, Inc. stock (AMZN) daily chart. It trades within a clear short-term downtrend following breaking down below its upward trend lines. The downtrend accelerated on Wednesday, and the stock continued lower on Thursday. On Friday we wrote that "we can see an attempt at bouncing off the support level of around $1,700" And the stock did bounce off the support level. For now, it looks like an upward correction:
Dow Jones' Bounce
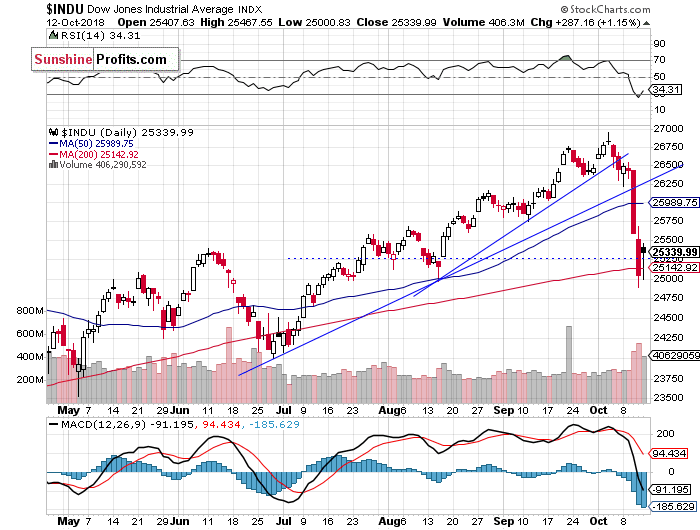
The Dow Jones Industrial Average reached its new all-time high at the level of 26,951.81 on October the 3rd. Then the blue-chip stocks' gauge broke below its two-month-long upward trend line. It looked like a downward correction, but the market fell below its medium-term upward trend line and the support level of around 26,000. Then it accelerated much lower. On Friday the market bounced off the support level of around 25,000. We may see some short-term fluctuations, maybe a bottoming pattern:
The S&P 500 index sold off last week, following breaking down below its early September local lows. The market sharply reversed its medium-term uptrend. Then it fell closer to 2,700 mark on Thursday. But will it continue much lower from here? We saw an attempt at bouncing off the mentioned medium-term support levels on Friday. There is the "October Effect" theory. It says that stocks tend to decline or crash during the month of October. Well, we can see a very sharp decline this month. So it is some kind of a stock seasonality pattern.
Concluding, the S&P 500 index will probably open lower today. The market trades within a short-term consolidation following the recent sell-off. There have been no confirmed short-term positive signals so far. However, we still can see some technical oversold conditions.
Want free follow-ups to the above article and details not available to 99%+ investors? Sign up to our free newsletter today!
Author

Paul Rejczak
Sunshine Profits
Paul Rejczak is a stock market strategist who has been known for the quality of his technical and fundamental analysis since the late nineties.


