Forex technical outlook

EUR/USD:
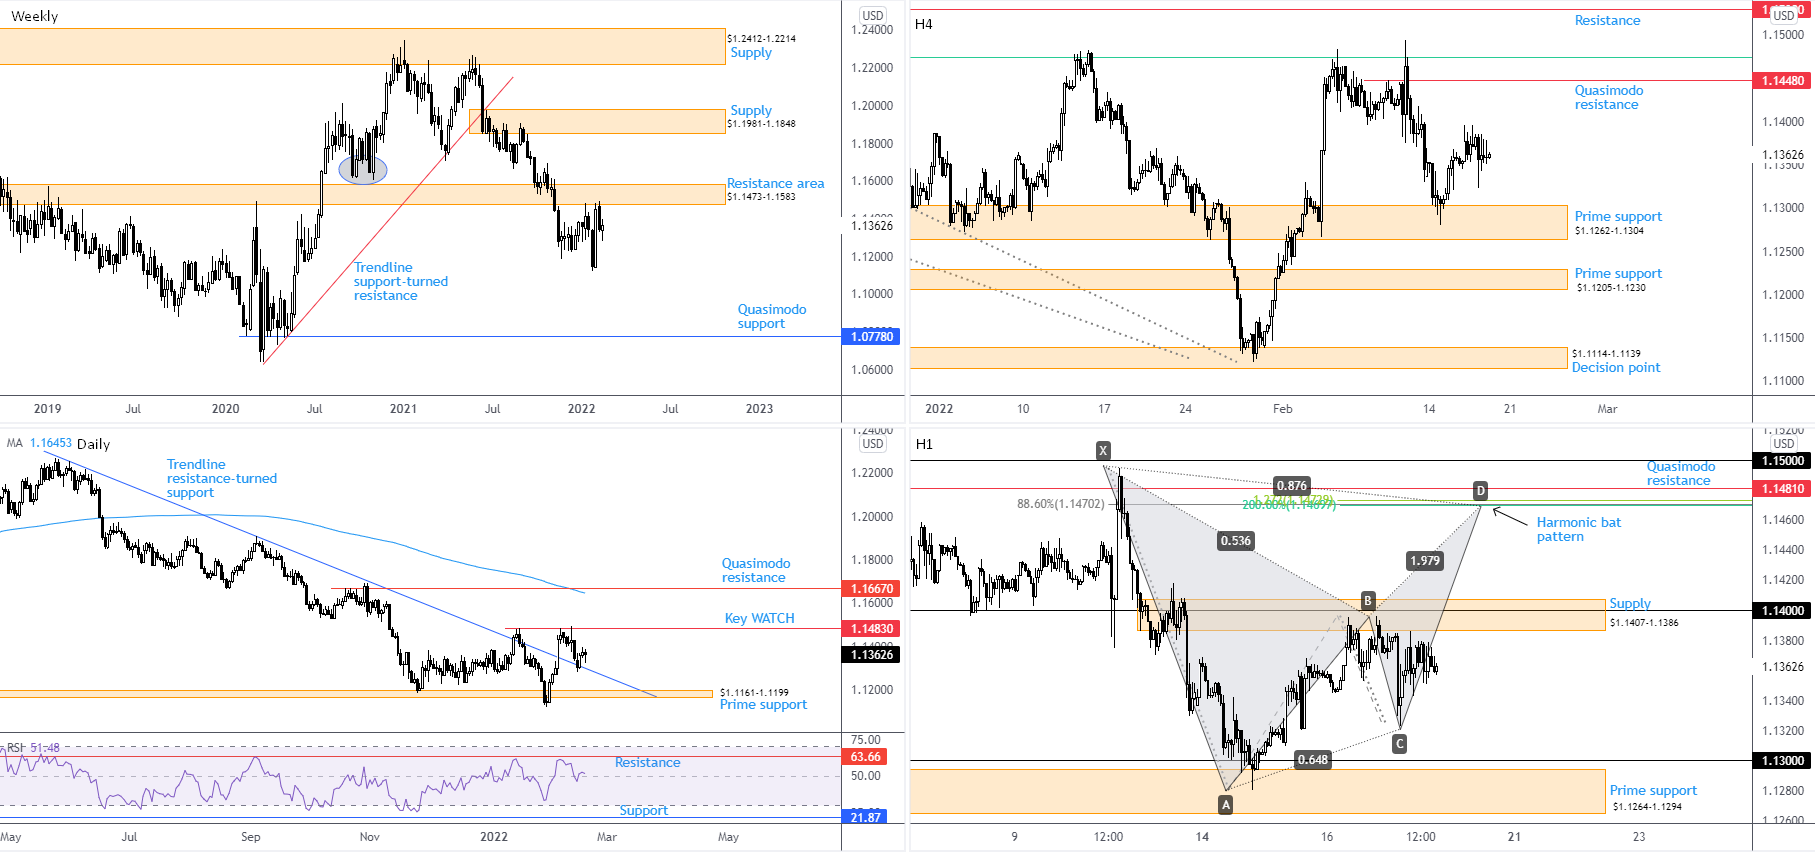
Technically, according to the overall trend, a decisive downside bias has been in play since topping at $1.2350 at the beginning of January (2021) on the weekly timeframe. This is reinforced by a weekly trendline support breach, drawn from the low $1.0636, and the break of the $1.1602 November 2020 low (circled). Lower on the curve, the daily timeframe witnessed a trendline resistance breach (taken from the high $1.2254) in early February, movement conflicting with the weekly timeframe’s position. However, until the $1.1483 14th January peak (marked key WATCH) is cleared on the daily, it’s difficult for traders to be bullish this market, medium term.
Not only are we seeing a difference of opinion in terms of trend studies between the weekly and daily timeframes, structurally both timeframes also contrast. Weekly price is seen rejecting the lower side of resistance at $1.1473-1.1583, while daily flow is rebounding from trendline resistance-turned support mentioned above (and the RSI is recoiling from the 50.00 centreline).
Against the technical backdrop of higher timeframes, prime support remains front and centre on the H4 at $1.1262-1.1304, promoting an approach to H4 Quasimodo resistance from $1.1448. H1 supply from $1.1407-1.1386, nonetheless, has proven stubborn. The reaction from the aforesaid supply and a subsequent $1.1323 session low on Thursday has fed technicians the possibility of a H1 harmonic bat pattern forming, boasting a tight PRZ (potential reversal zone) around $1.1470 (south of H1 Quasimodo resistance at $1.1481).
Going forward, chart studies suggest weakness around H1 supply at $1.1407-1.1386. This is due to the daily timeframe rebounding from trendline resistance-turned support, taken from the high $1.2254, as well as scope for the H4 to run for Quasimodo resistance at $1.1448.
Traders considering long positions in this market are likely to exercise a cautious stance and seek confirmation by way of a H1 close above $1.14 before looking to pursue H4 Quasimodo resistance at $1.1448, followed by the H1 harmonic bat pattern’s PRZ around $1.1470 (strong short-term resistance). This is due to the current trend on the weekly timeframe and weekly price recently retesting the lower side of resistance at $1.1473-1.1583.
AUD/USD:
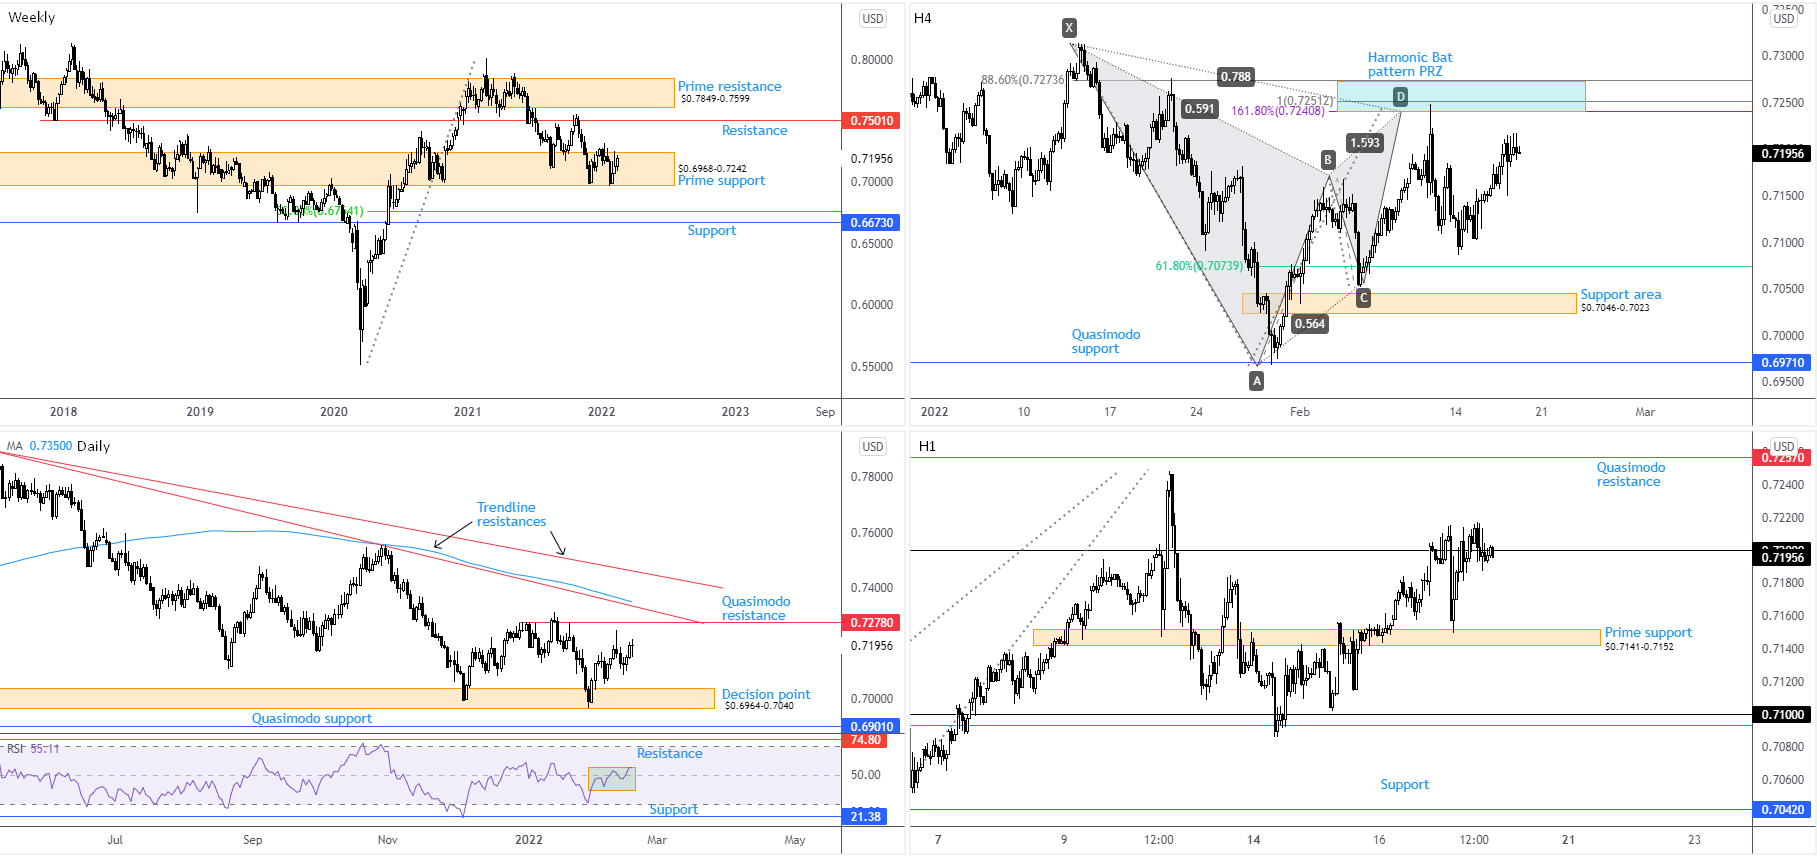
Trend studies on AUD/USD are interesting. Longer term—the monthly timeframe—has portrayed a downtrend since August 2011, suggesting the 12.6 percent correction from mid-Feb tops at $0.8007 (2021) on the weekly timeframe might be the start of a bearish phase and not a correction from the 2021 advance from pandemic lows of $0.5506. The downside bias is supported on the daily timeframe: price remains comfortable under its 200-day simple moving average, currently flirting with $0.7350.
Structurally, weekly prime support remains in the fight at $0.6968-0.7242, though has struggled to ignite much bullish interest since late November 2017. However, reinforcing a bullish showing, albeit medium term, is the daily timeframe exhibiting space to elbow higher until shaking hands with Quasimodo resistance at $0.7278, shadowed closely by two trendline resistances, drawn from highs of $0.8007 and $0.7891.
Lower on the curve, prime support on the H1 timeframe at $0.7141-0.7152 put in an appearance in early trading on Thursday and underpinned another attack on $0.72. Conquering the aforesaid level suggests last Thursday’s high at $0.7249 could enter the frame, followed closely by H1 Quasimodo resistance at $0.7257. What is also interesting is the H4 timeframe’s (used) harmonic Bat pattern’s PRZ between $0.7274 and $0.7241 houses H1 resistances noted above.
According to technical studies across all four timeframes, analysis points to a more decisive break of $0.72 to the upside on the H1, with follow-through buying taking aim at the H1 timeframe’s Quasimodo resistance at $0.7257.
USD/JPY:
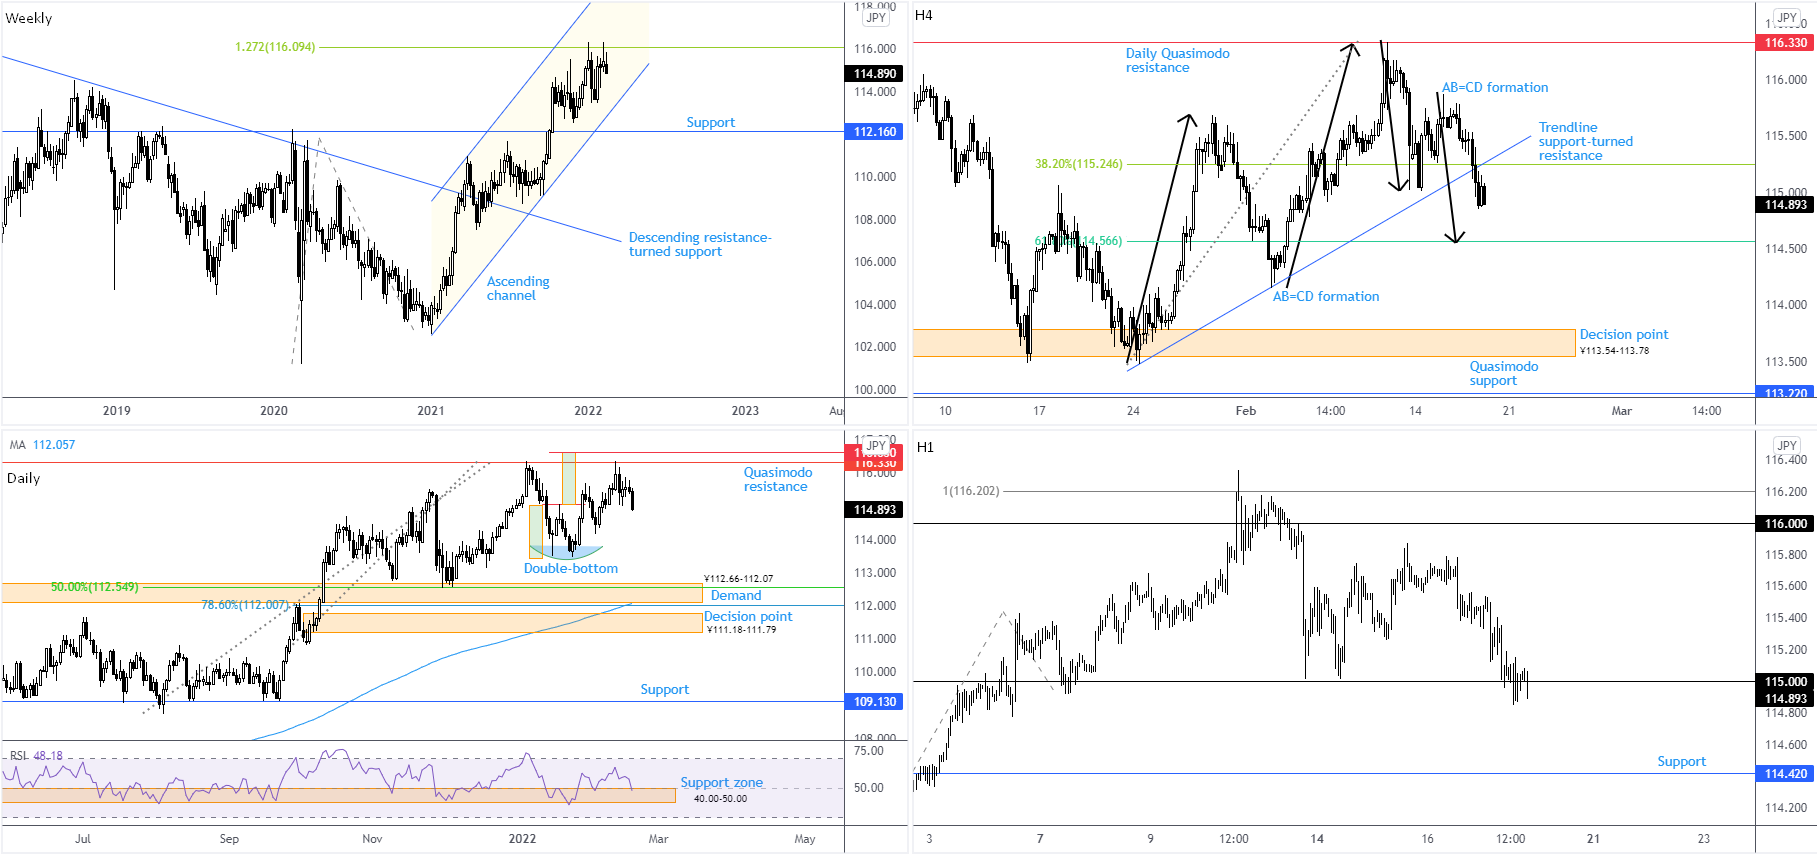
The trend in this market favours buyers at the moment. The currency pair has been stepping higher since early 2021, clearly visible on the weekly timeframe. In line with this, the overall longer-term trend has also been climbing since 2012. The 21.5 percent correction from June 2015 to June 2016 provided a dip-buying opportunity, as did the subsequent 14.8 percent correction from December 2016 to pandemic lows formed early March 2020.
Weekly channel support and daily demand from ¥112.66-112.07, therefore, deliver a possible dip-buying area to watch over the coming weeks. Upside objectives to be mindful of are the weekly timeframe’s 1.272% Fibonacci projection at ¥116.09 and the daily timeframe’s Quasimodo resistance from ¥116.33, as well as the double-bottom pattern’s (¥113.48) profit objective at ¥116.63. Also of technical relevance is the relative strength index (RSI) on the daily chart, testing support between 40.00 and 50.00 (a ‘temporary’ oversold range since 10th May—common view in trending markets). A rebound from here suggests positive momentum until overbought levels are tested.
Out of the H4 scale, bearish forces submerged a familiar 38.2% Fibonacci retracement at ¥115.25 (a level derived from legs A-D of an AB=CD structure [black arrows] that converged with daily Quasimodo resistance underlined above at ¥116.33) and trendline support, drawn from the low ¥113.47. This potentially sets the technical stage for price to drop in on a 61.8% Fibonacci retracement at ¥114.57 (considered by many to be a second profit objective from the H4 AB=CD pattern’s A-D legs), echoing the possibility of an AB=CD bullish formation that completes at the 61.8% Fibonacci ratio.
A closer reading on the H1 timeframe shows price engaging with ¥115, threatening a break lower and possible follow-through to H1 support at ¥114.42. Technicians may also acknowledge the aforesaid support shares chart space closely with the H4 timeframe’s 61.8% Fibonacci retracement at ¥114.57.
Although the overall trend still favours buyers, the H4 demonstrating space to move in for the 61.8% Fibonacci retracement at ¥114.57 and intersecting AB=CD bullish formation, as well as the H1 poised to overthrow ¥115, informs short-term traders a drop to ¥114.50 could play out, which also may deliver a floor of support for buyers to work with.
GBP/USD:
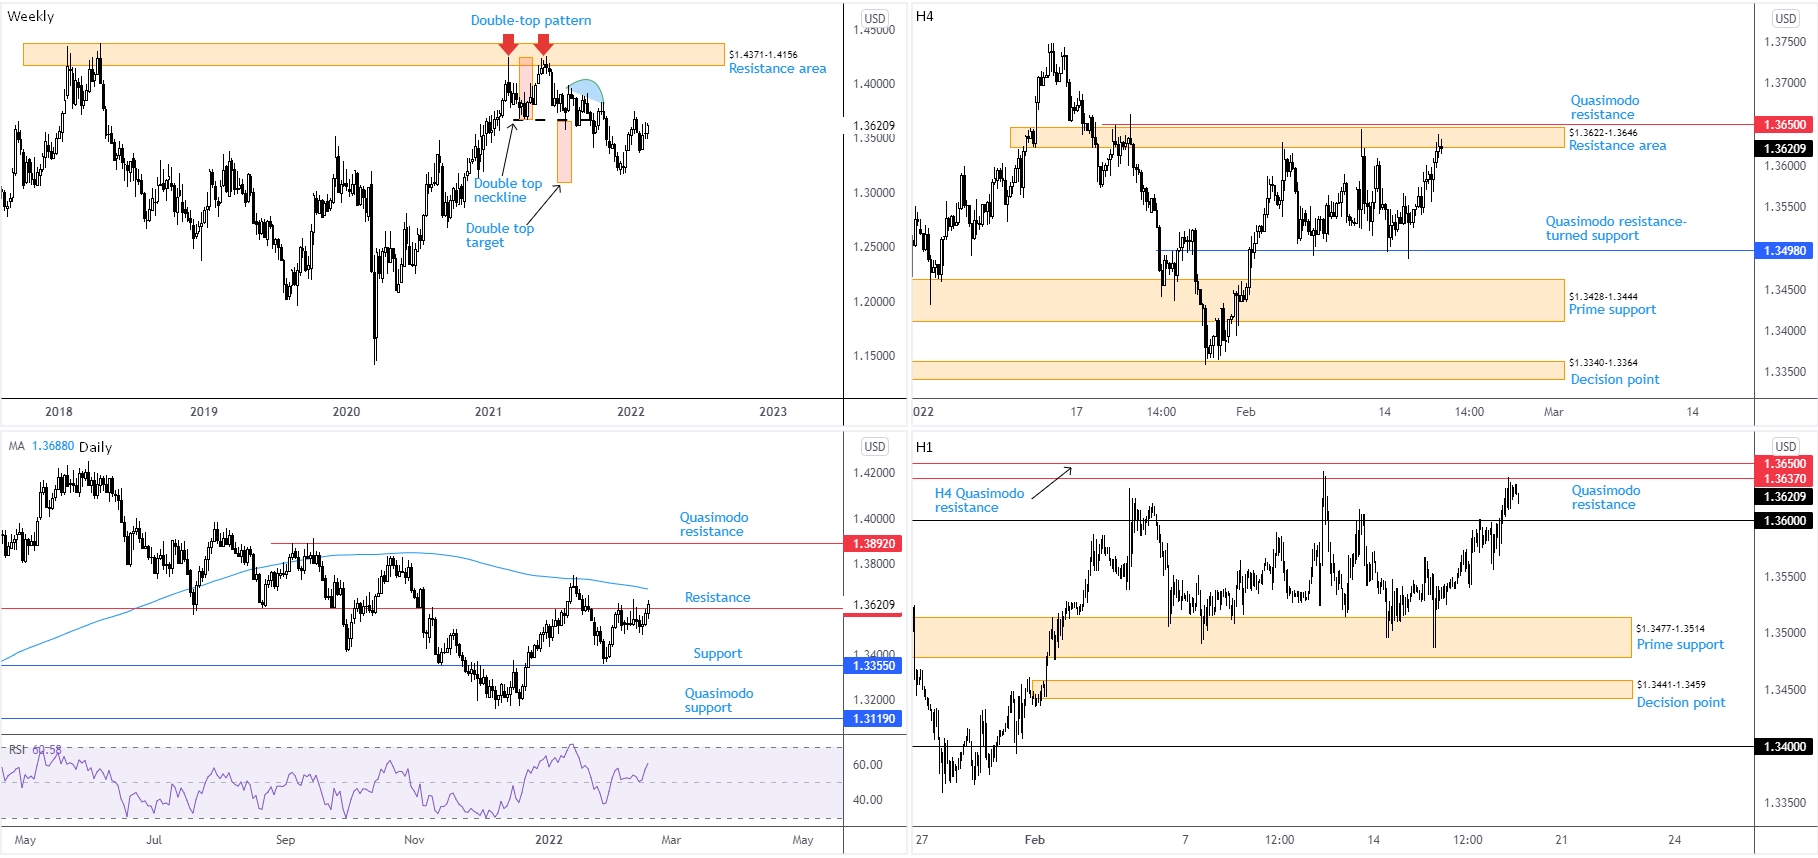
Longer-term trend direction has been southbound since late 2007 tops at $2.1161. As a result, the move from pandemic lows in March 2020 could be viewed as a pullback within the larger downtrend. This places a question mark on the 7.5 percent ‘correction’ from February 2021 to December 2021; it may in fact be the beginning of a longer-term push to the downside and not a dip-buying scenario.
Despite the trend underlining a southerly ‘wind’, price action on the daily timeframe mustered enough strength to engulf resistance on Thursday from $1.3602 and make room to zero in on the 200-day simple moving average at $1.3688. Note, market action has been under the SMA since mid-September 2021.
Lower timeframes shine light on a H4 consolidation between resistance at $1.3622-1.3646 (arranged beneath Quasimodo resistance at $1.3650) and Quasimodo resistance-turned support at $1.3498. H1 movement is also currently crossing swords with Quasimodo resistance at $1.3637, action that could lead to price dropping in on $1.36.
Should H1 price retest (and defend) $1.36, this offers traders an early cue that the daily price may hold north of $1.3602 resistance and reach for the 200-day SMA at $1.3688. Though it is important to note that a bullish scene from $1.36 entails taking on H1 Quasimodo resistance at $1.3637, H4 resistance at $1.3622-1.3646 and Quasimodo resistance at $1.3650.
Author

Aaron Hill
FP Markets
After completing his Bachelor’s degree in English and Creative Writing in the UK, and subsequently spending a handful of years teaching English as a foreign language teacher around Asia, Aaron was introduced to financial trading,


