Forex technical analysis and forecast: Majors, equities and commodities

EUR/USD, “Euro vs US Dollar”
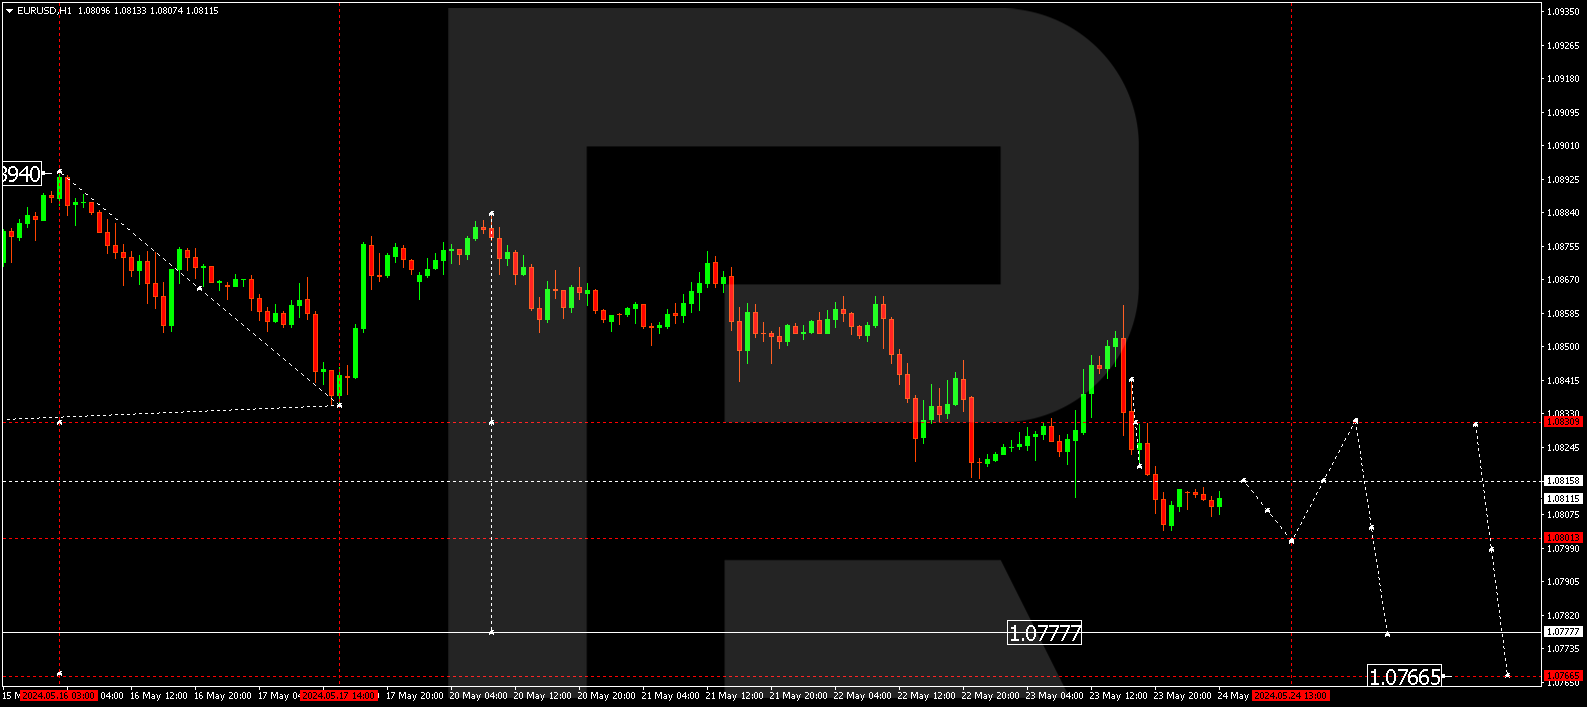
The EURUSD pair has performed a wave of decline to 1.0803. Today, the market is forming a consolidation range above this level, potentially further declining towards 1.0801. A subsequent correction towards 1.0830 is probable, followed by a potential decline to 1.0777, serving as a local target.
GBP/USD, “Great Britain Pound vs US Dollar”
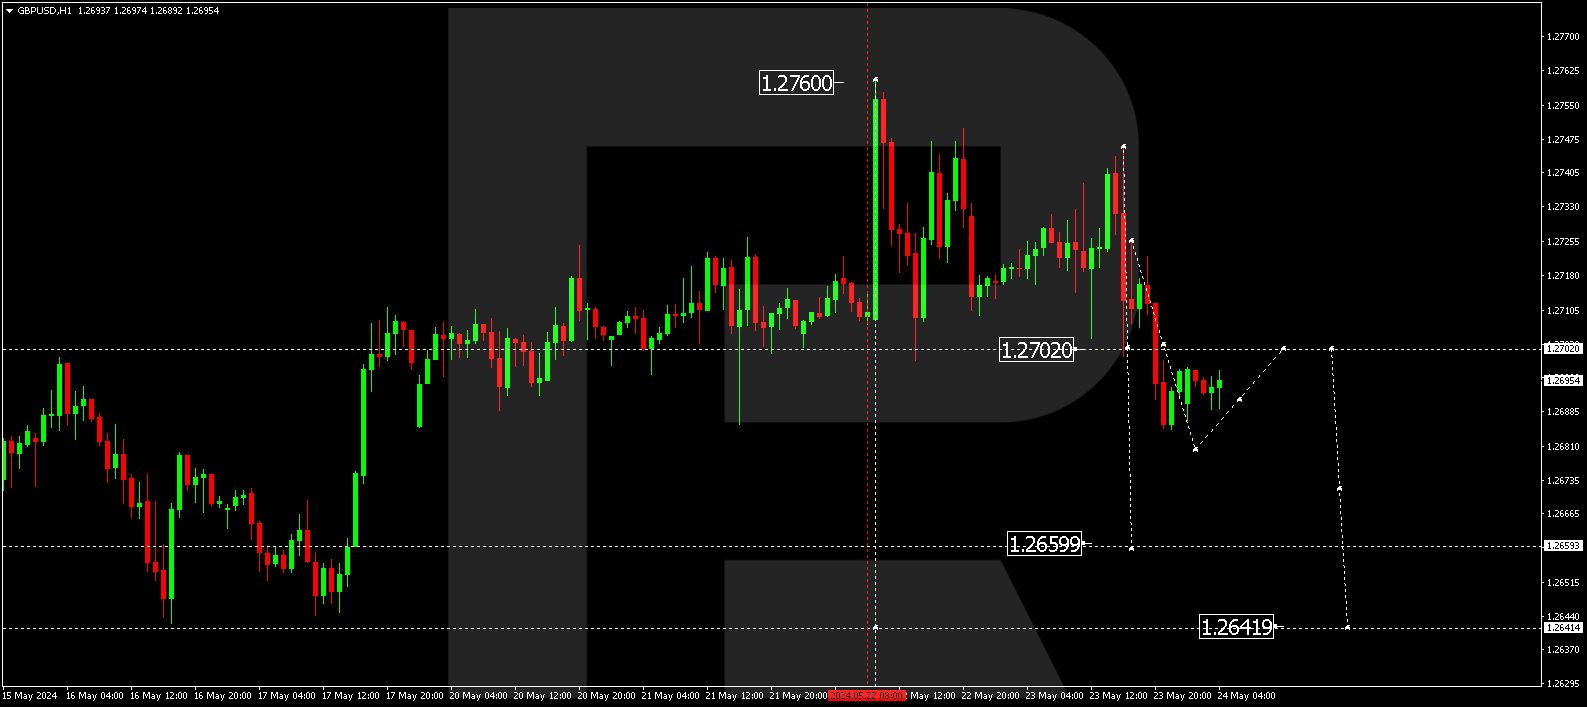
The GBPUSD pair broke through 1.2702 and continues its decline towards 1.2678. After reaching this level, a rise towards 1.2702 (testing from below) is possible, followed by a potential decline to 1.2660, serving as a local target. Following this, a correction towards 1.2702 could be considered.
USD/JPY, “US Dollar vs Japanese Yen”
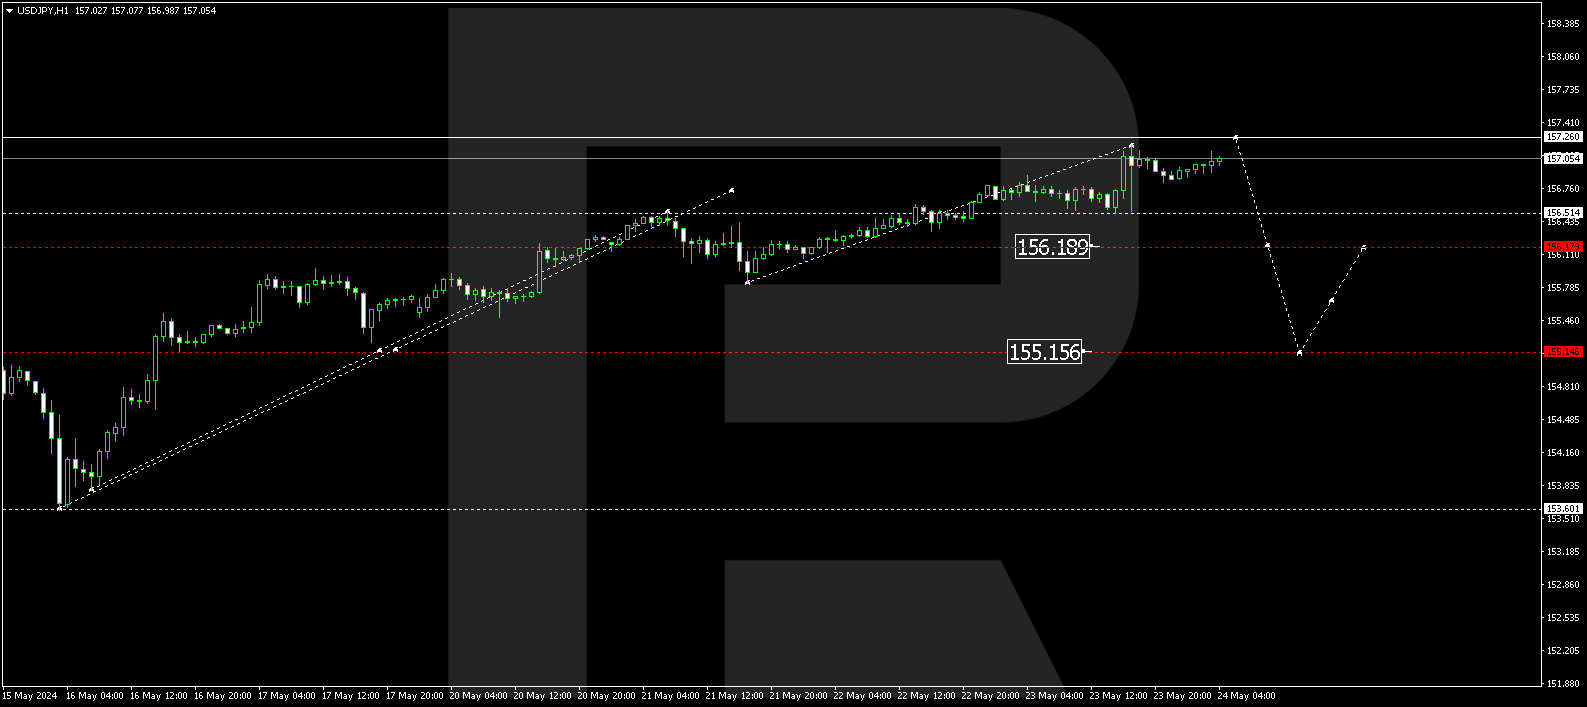
The USDJPY pair found support at 156.52 and may rise towards 157.26. Following this, the price may decline to 156.19, with a breakout below this level opening the potential for a wave towards 155.15, serving as the first target.
USD/CHF, “US Dollar vs Swiss Franc”
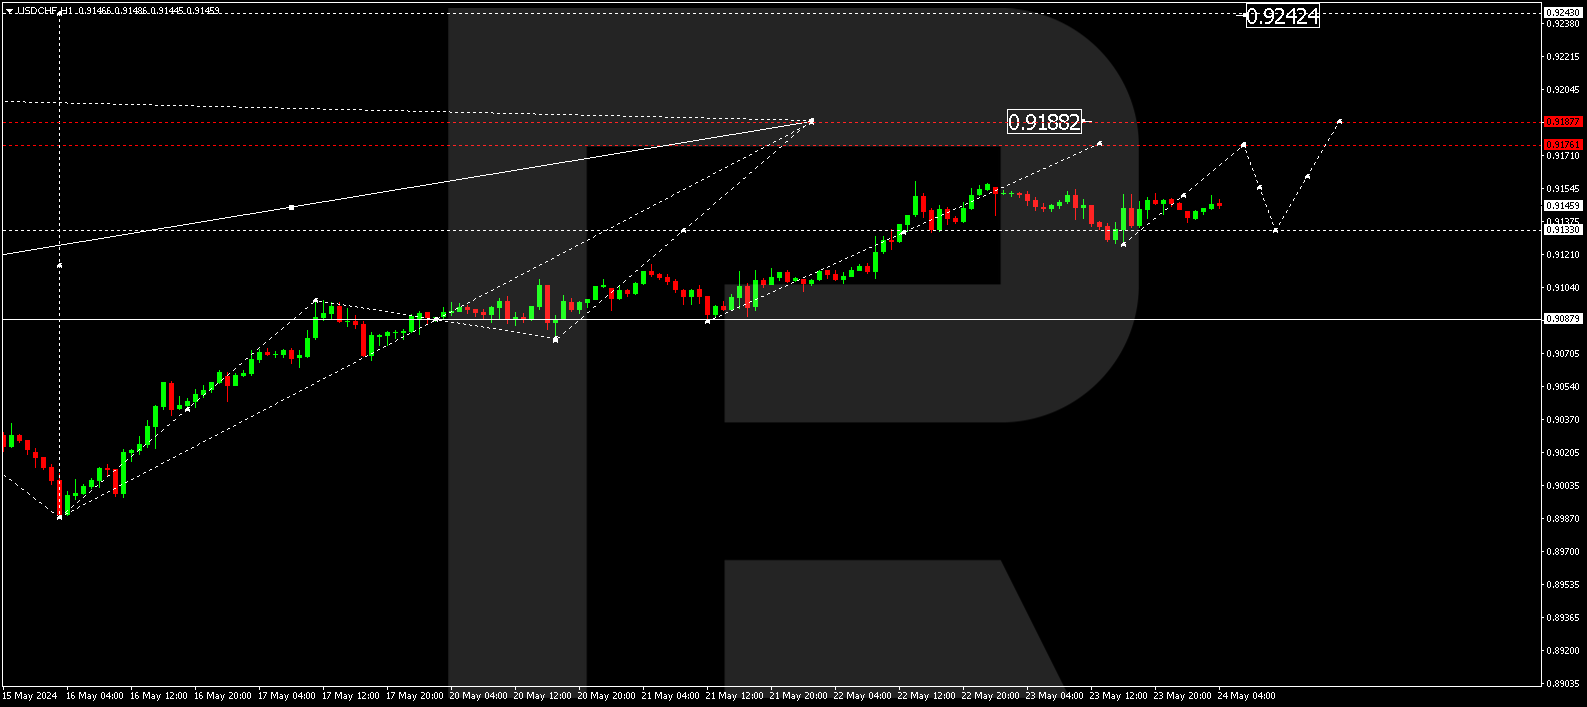
The USDCHF pair continues to develop a consolidation range above 0.9133. Today, a rise towards 0.9176 is expected, potentially extending to 0.9188. Following this, a correction towards 0.9090 could be considered.
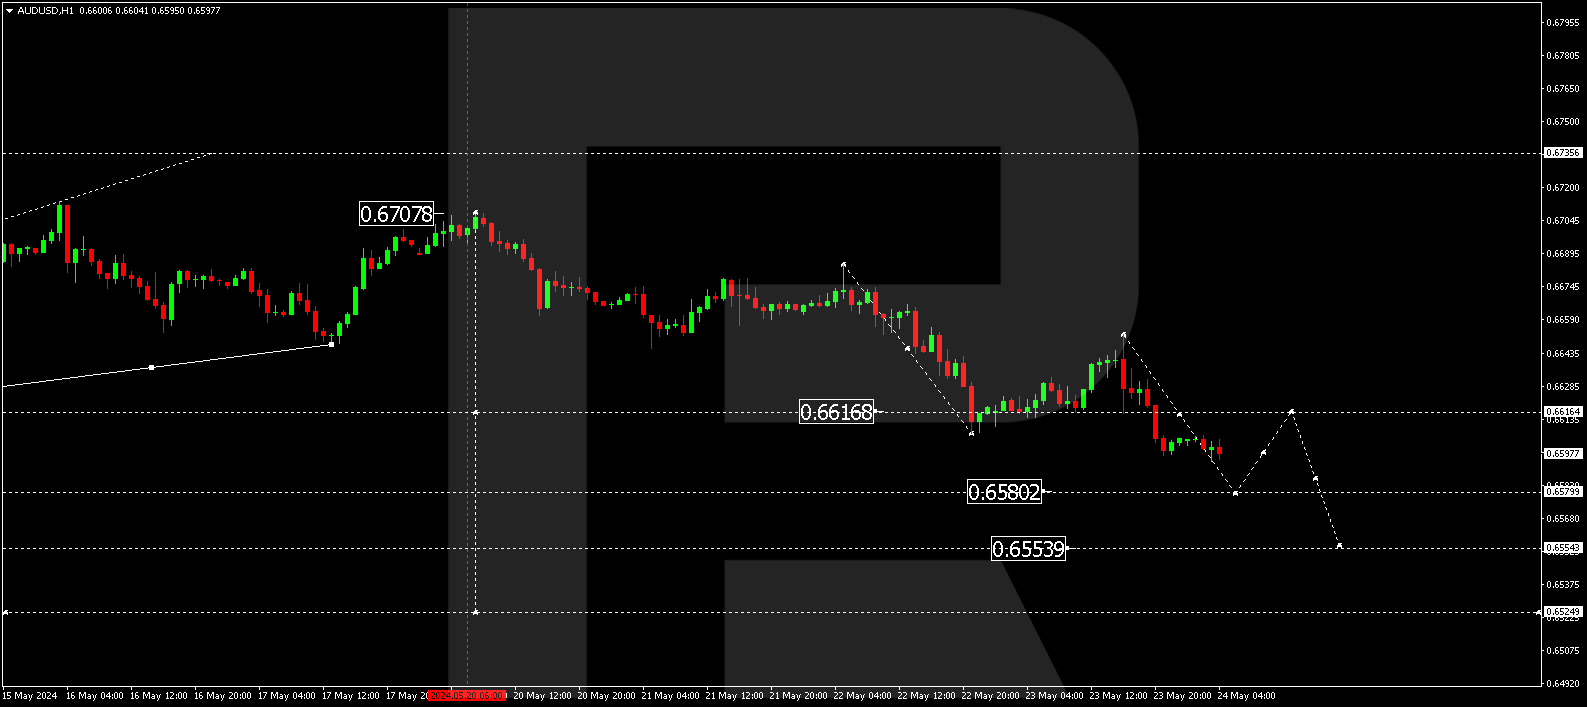
AUD/USD, “Australian Dollar vs US Dollar”
The AUDUSD pair is undergoing a downward wave towards 0.6580. After reaching this level, a correction towards 0.6616 (testing from below) is possible. Subsequently, the price may decline to 0.6554, serving as a local target.
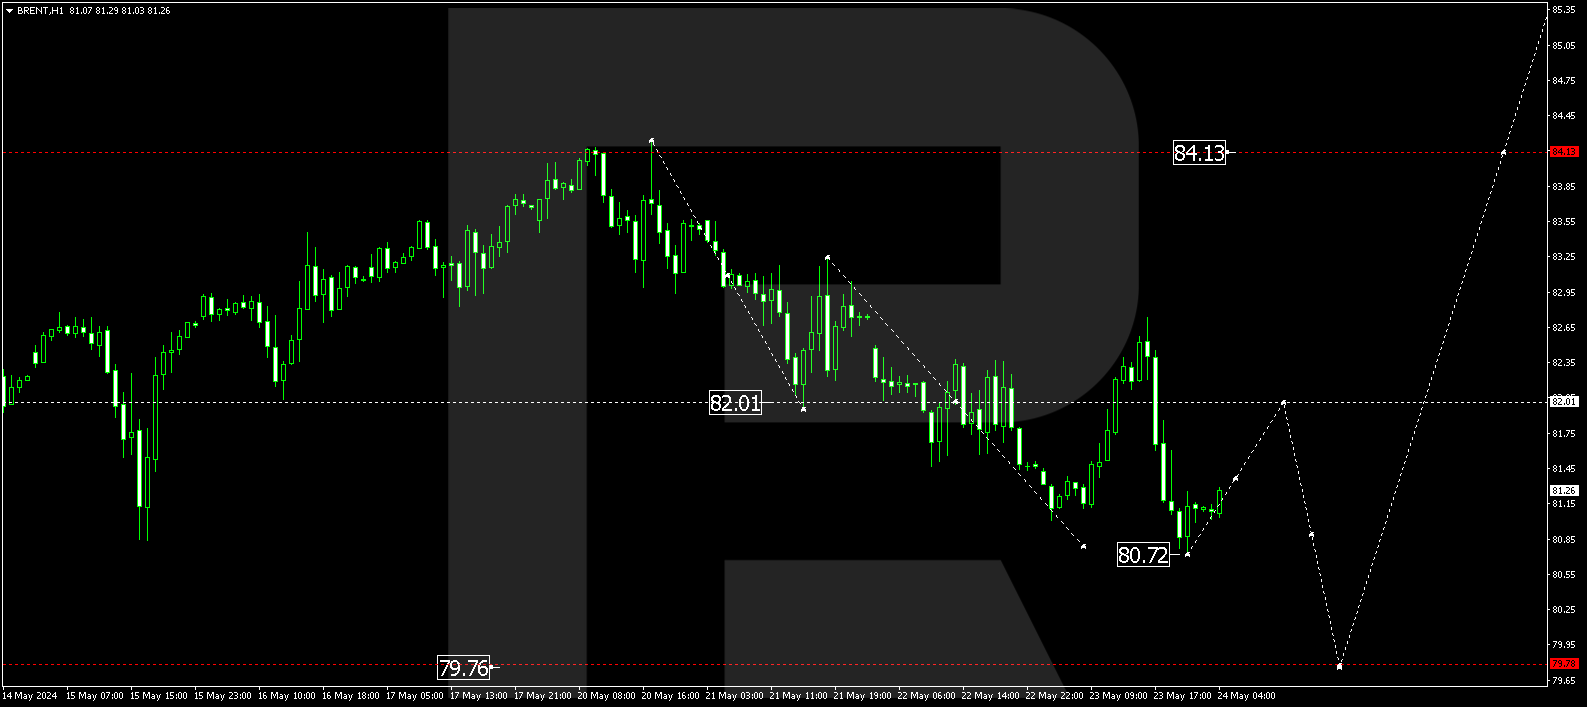
Brent
Brent oil continues to develop a correction, with the local target at 80.72 already reached. Today, a rise towards 82.00 is probable, followed by another correction towards 79.79. Subsequently, a new growth wave towards 84.10 is expected, serving as the first target.
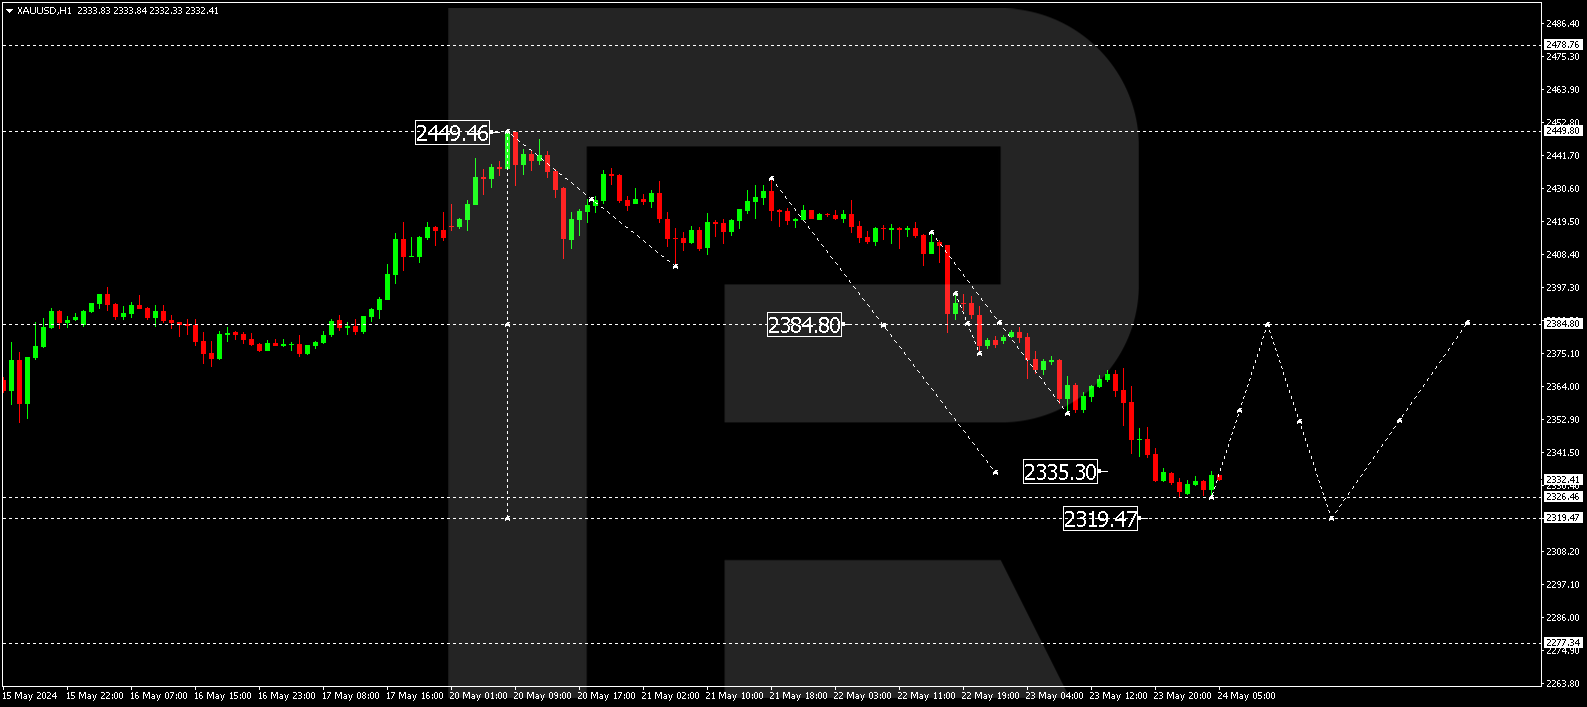
XAU/USD, “Gold vs US Dollar”
Gold has performed a wave of decline to 2326.46. Today, the market is forming a consolidation range above this level. An upward breakout could initiate a correction towards 2384.80 (testing from below). Subsequently, the price may decline to 2319.50, serving as the first target of the decline wave.
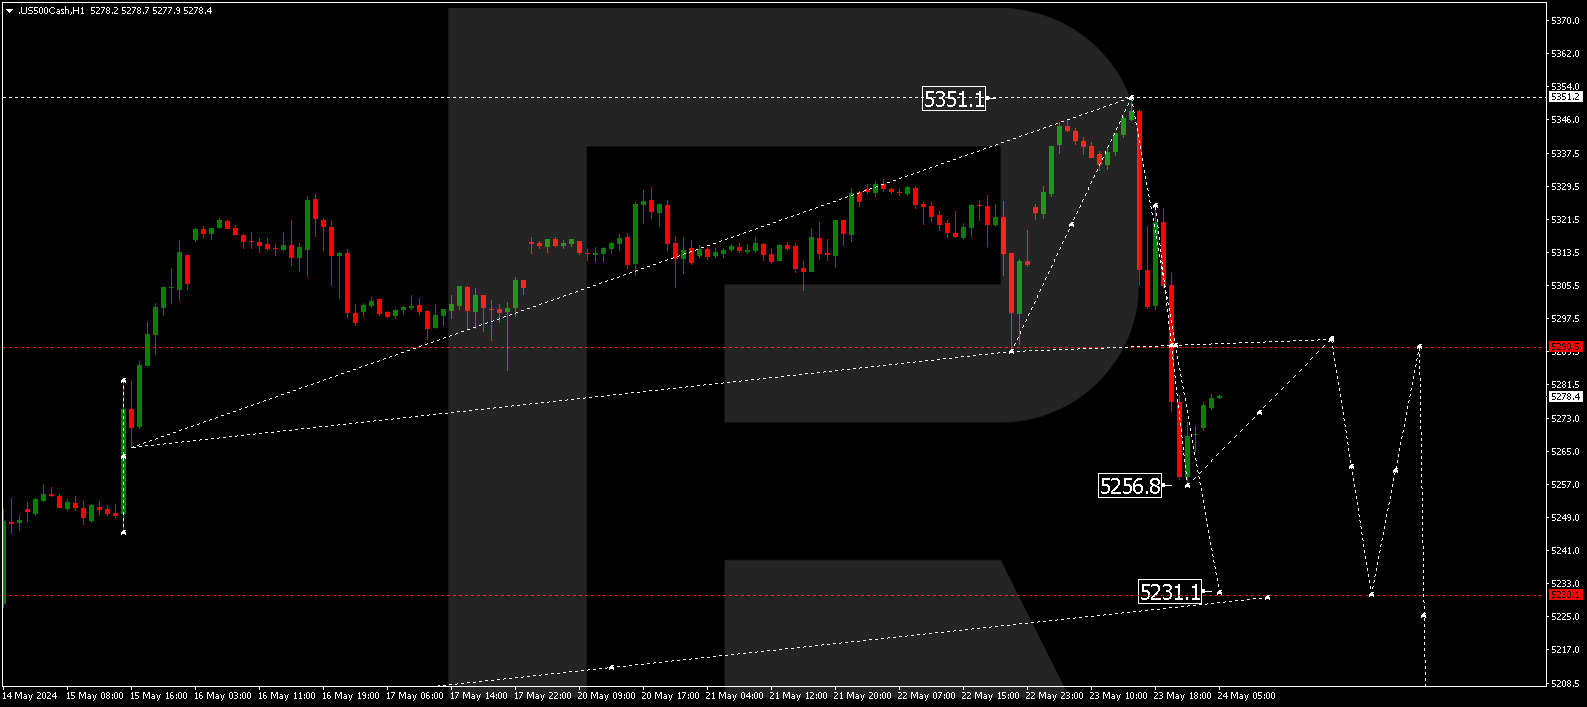
S&P 500
After rebounding from 5351.1, the S&P 500 index has commenced a downward wave towards 5231.1. After reaching this level, a correction towards 5290.5 (testing from below) is possible, followed by a new decline wave towards 5200.0.
Author

RoboForex Team
RoboForex
RoboForex Team is a group of professional financial experts with high experience on financial market, whose main purpose is to provide traders with quality and up-to-date market information.


