Forex technical analysis and forecast: Majors, equities and commodities

EUR/USD, “Euro vs US Dollar”
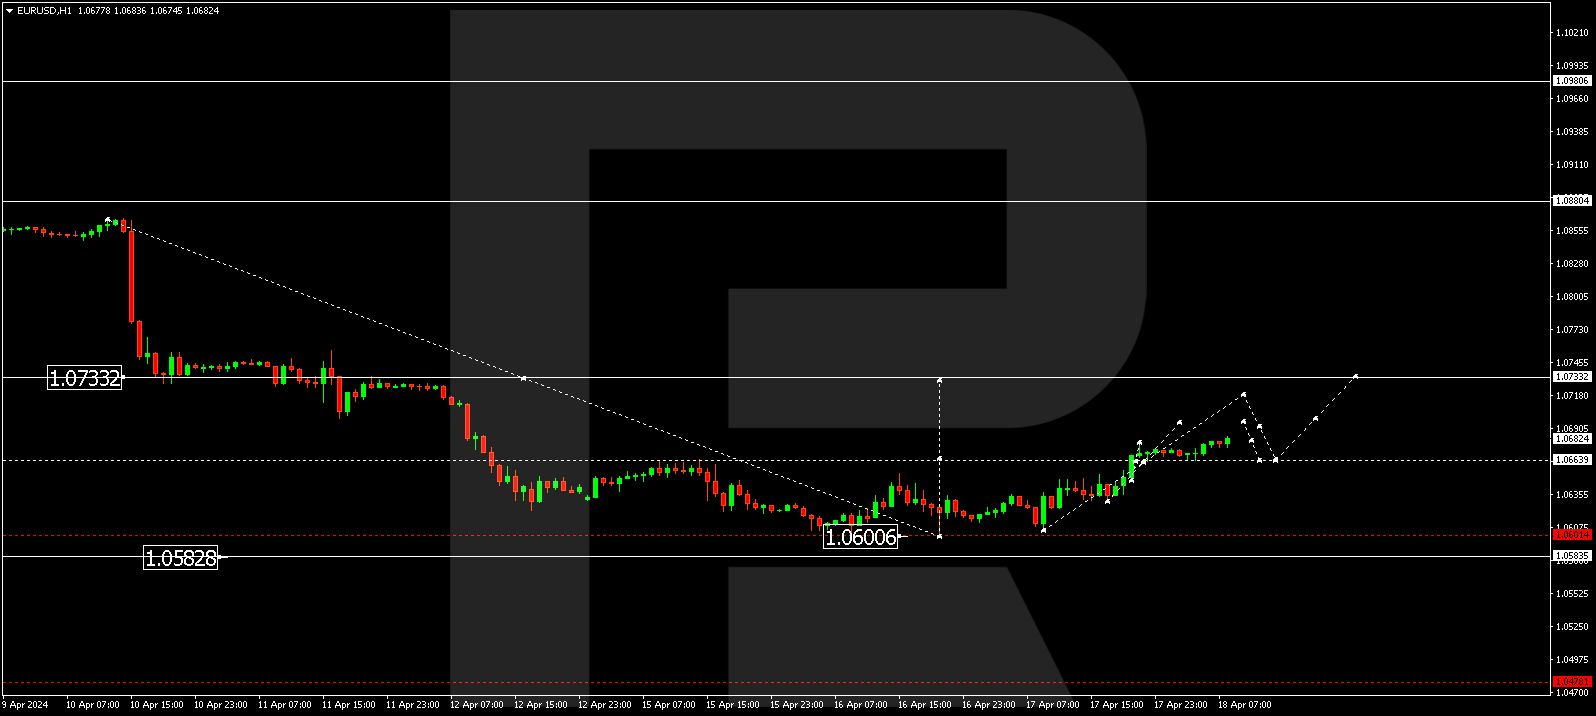
The EURUSD pair has completed a growth structure, reaching 1.0664. Today, the market has formed a consolidation range around this level. A downward breakout will open the potential for a movement to the local target of 1.0585. With an upward breakout, the correction might continue to 1.0733 (testing from below). Next, the price could decline to 1.0585, from where the trend might develop to 1.0480.
GBP/USD, “Great Britain Pound vs US Dollar”
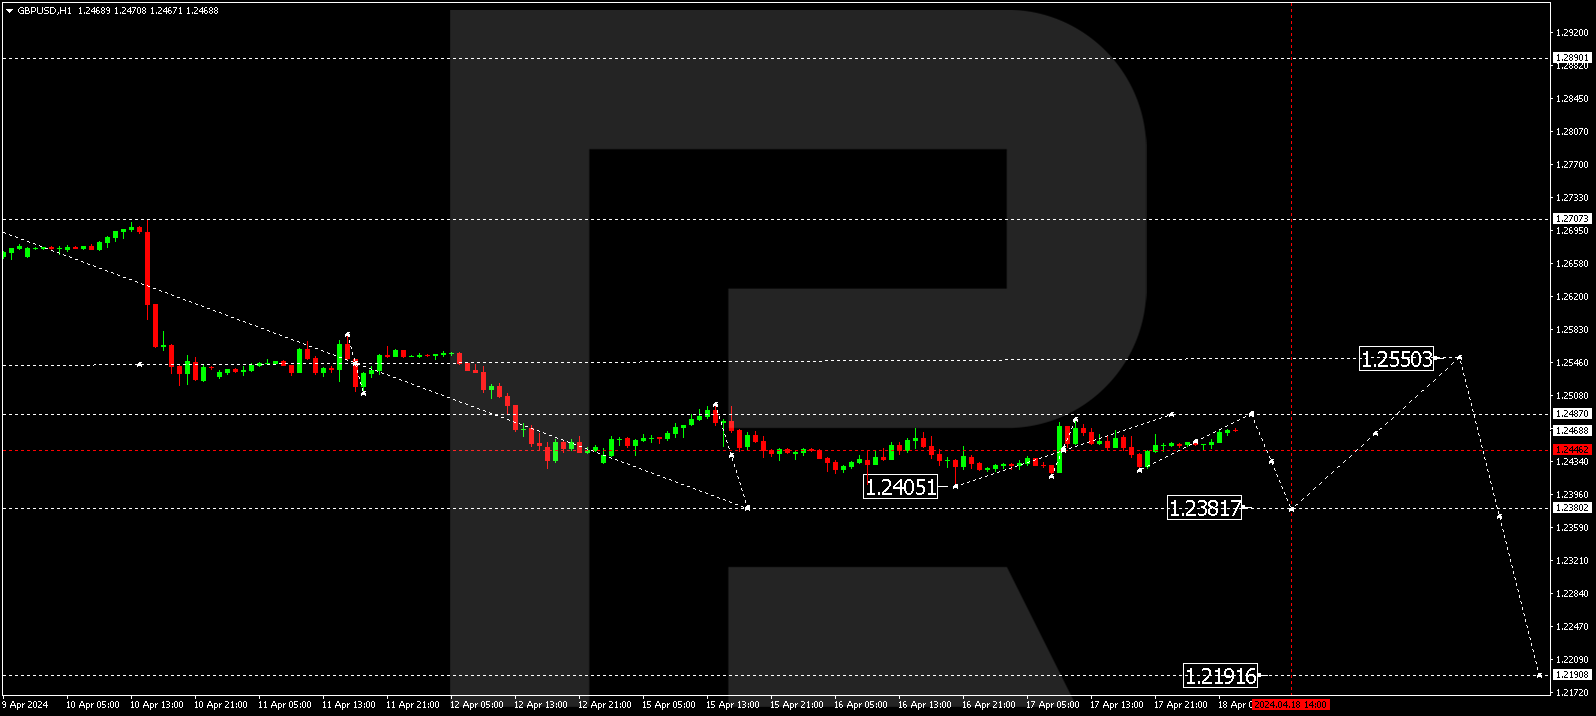
The GBPUSD pair is currently in a consolidation phase around 1.2444. The price might rise to 1.2487 today, practically forming a correction of the previous decline wave. Once the correction is over, a new decline wave could start, aiming for the local target of 1.2381.
USD/JPY, “US Dollar vs Japanese Yen”
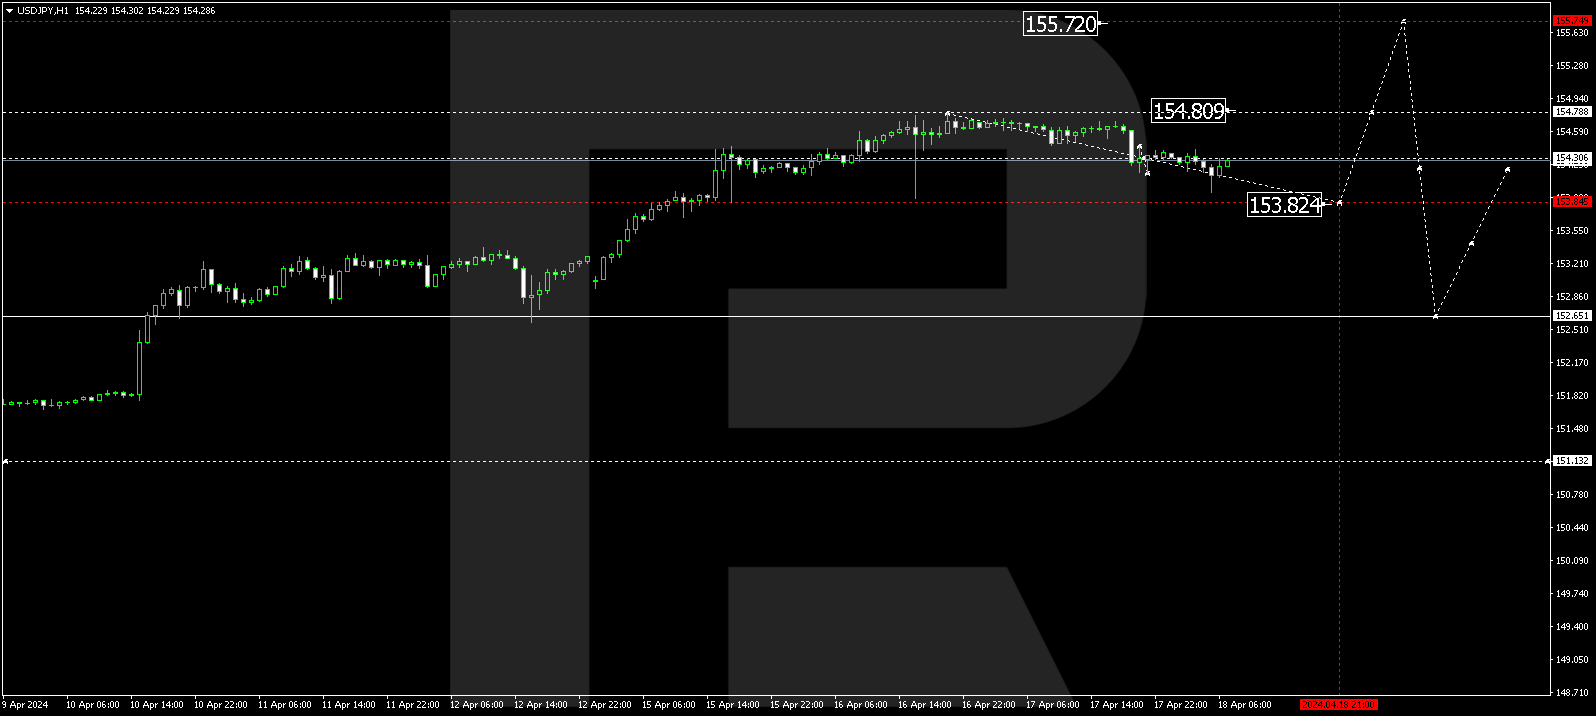
The USDJPY pair has formed a consolidation range around 154.30. Another link of decline towards 153.83 is not ruled out. The decline is interpreted as a correction of the previous upward momentum. Once the correction is over, a new growth wave targeting 154.80 could start. A breakout of this level will open the potential for the trend continuation to 155.75.
USD/CHF, “US Dollar vs Swiss Franc”
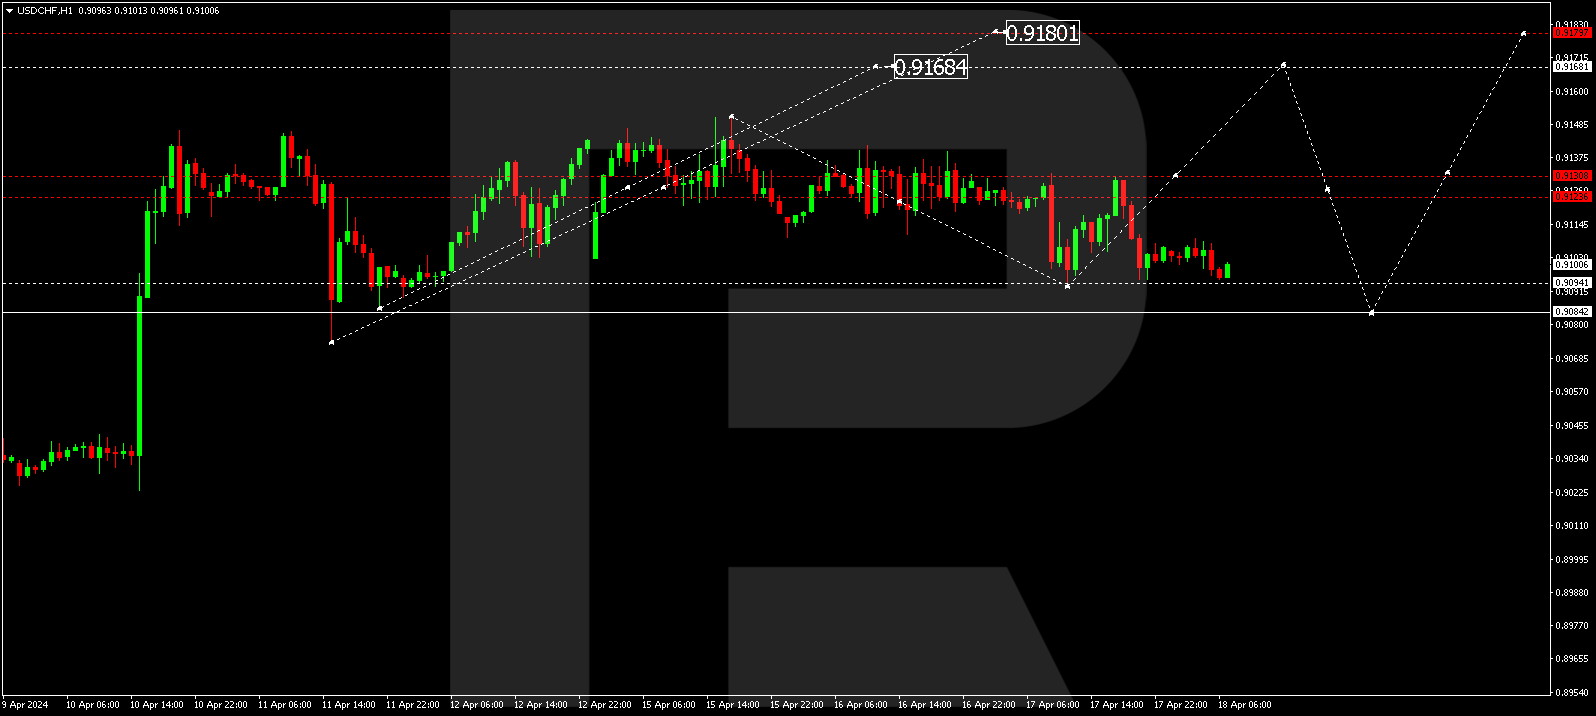
The USDCHF pair is currently in a consolidation phase above 0.9094. A decline to 0.9084 is not ruled out today, which is interpreted as a correction of the previous growth wave. After the correction, a new growth wave targeting 0.9168 could start, with the trend potentially continuing to 0.9180.
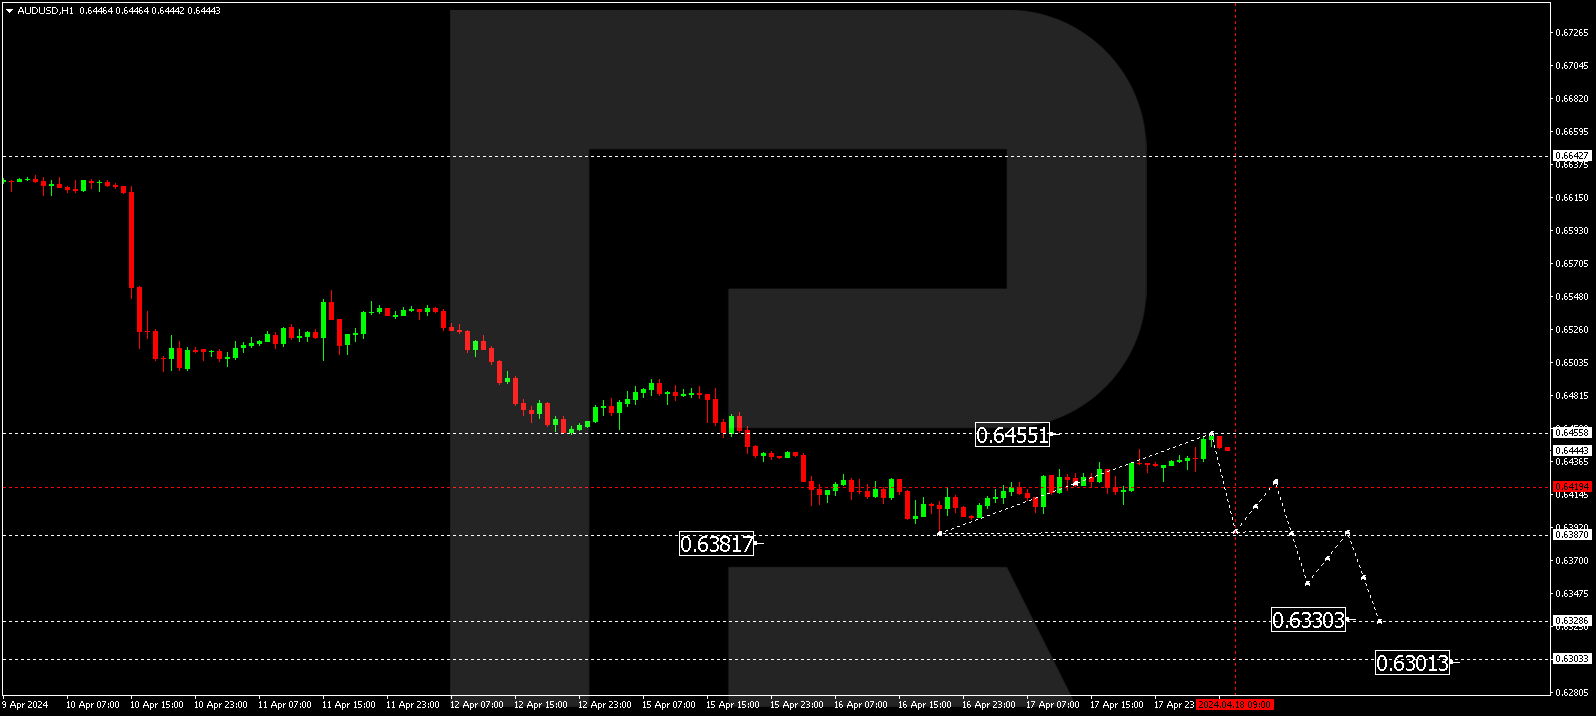
AUD/USD, “Australian Dollar vs US Dollar”
The AUDUSD pair has completed a correction wave, reaching 0.6455. The market is forming a consolidation range below this level today. With a downward breakout, the movement might continue to 0.6380, from where the trend could expand to the local target of 0.6330.
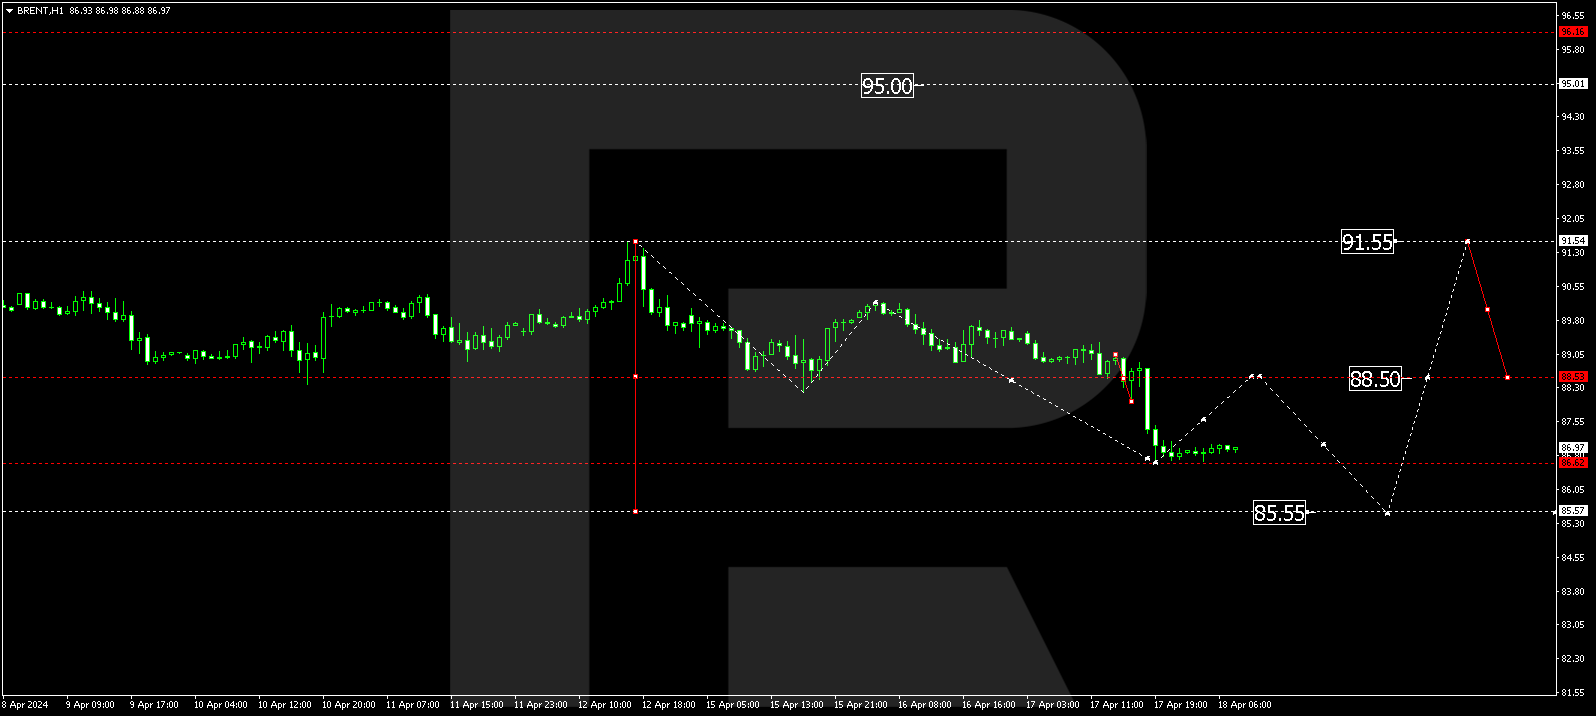
Brent
Brent has formed a consolidation range around 88.53 and, breaking below it, continues to develop a correction. Today, the market has completed a decline to 86.66. A growth structure targeting 88.50 (testing from below) could occur, followed by a decline to 85.55. Subsequently, a new growth wave towards 91.55 might start, with the trend potentially continuing to 95.00.
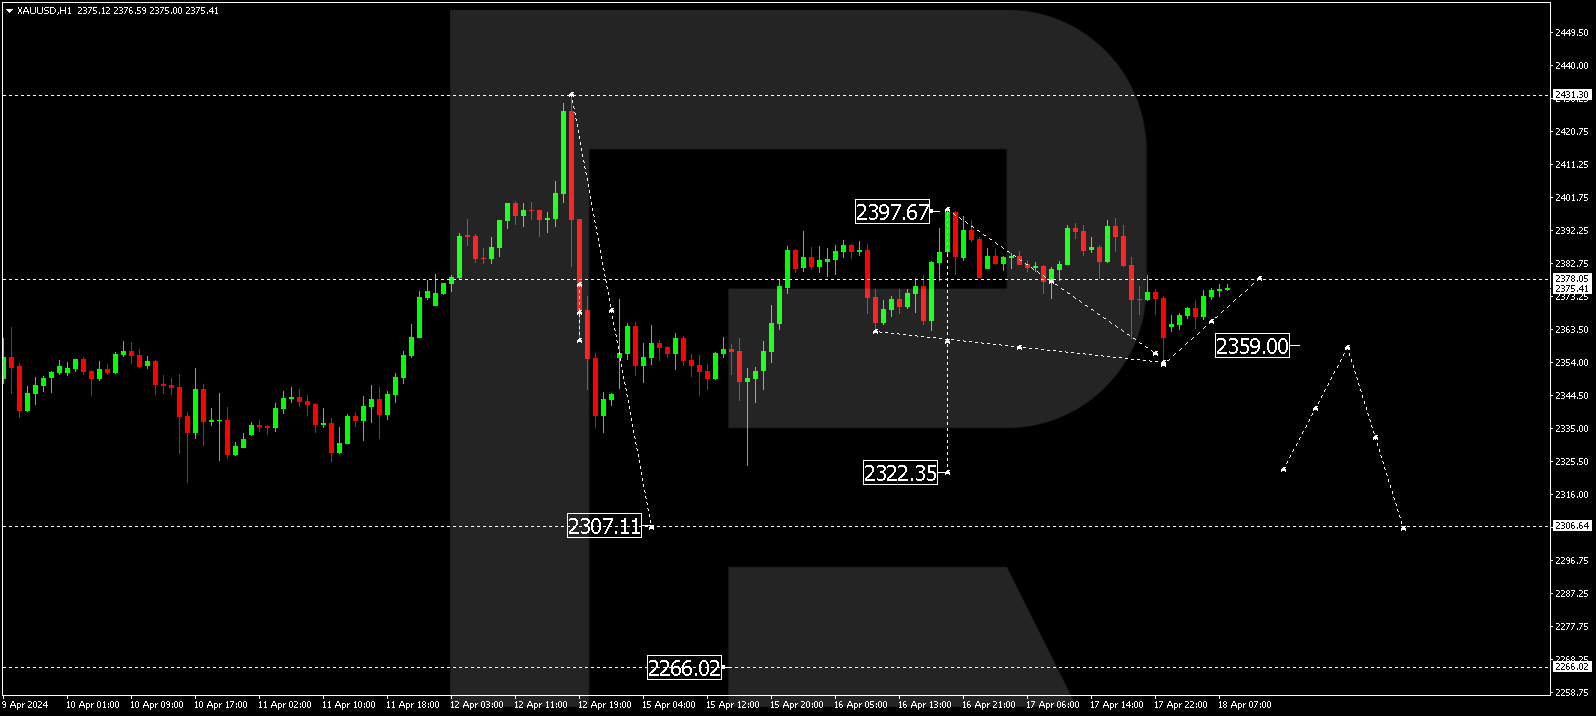
XAU/USD, “Gold vs US Dollar”
Gold is currently in a consolidation phase around 2378.00. With a downward breakout, a corrective decline to 2306.66 is expected, followed by a rise to 2355.00 and a subsequent fall to 2266.00. With an upward breakout, the price might rise to 2400.00. After reaching this level, the price could decline to 2300.00.
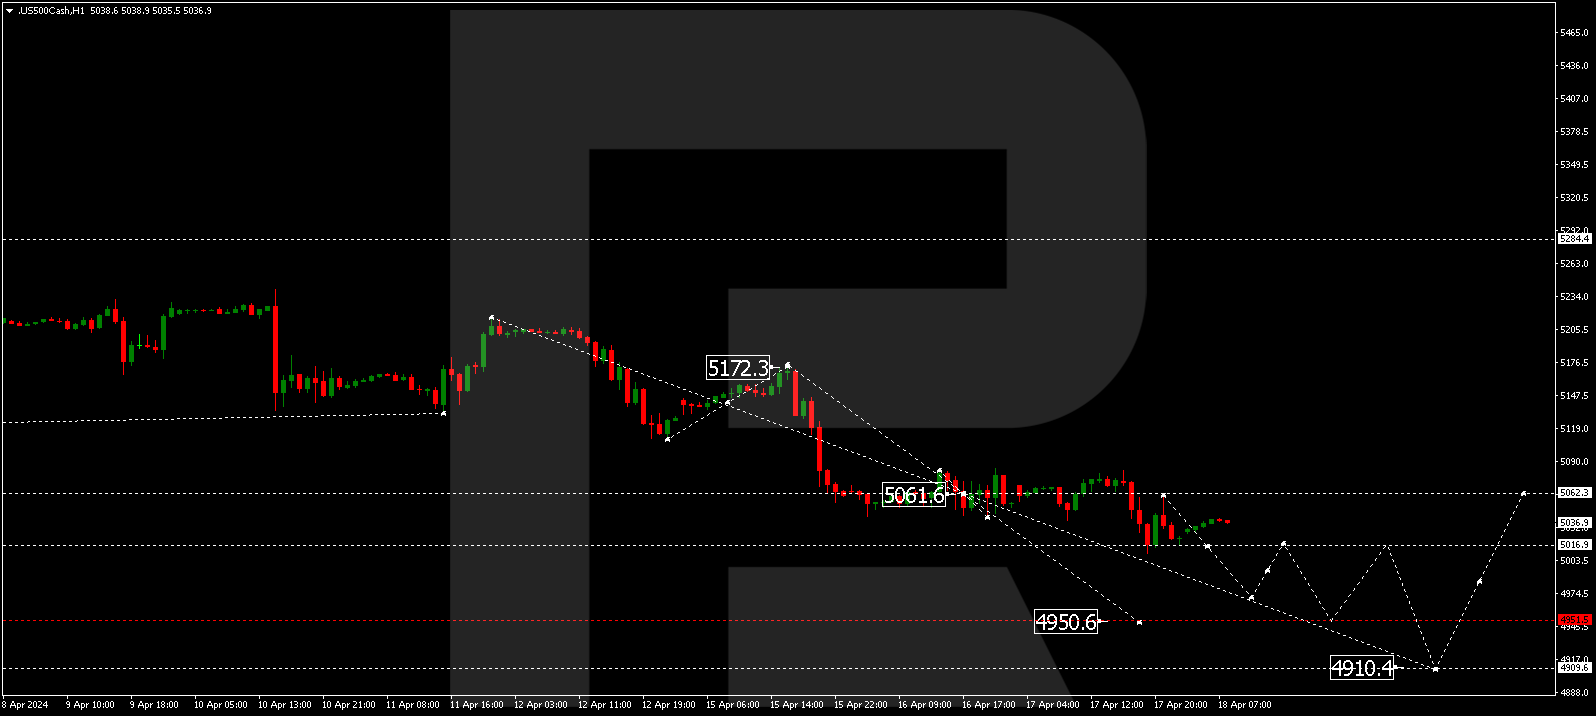
S&P 500
The stock index has completed a decline wave, reaching 5010.0. The market is forming a consolidation range above this level today. With an upward breakout, a correction phase targeting 5062.0 is not ruled out, followed by a decline to 5000.5, from where the trend might continue to 4950.5.
Author

RoboForex Team
RoboForex
RoboForex Team is a group of professional financial experts with high experience on financial market, whose main purpose is to provide traders with quality and up-to-date market information.


