Forex technical analysis and forecast: Majors, equities and commodities

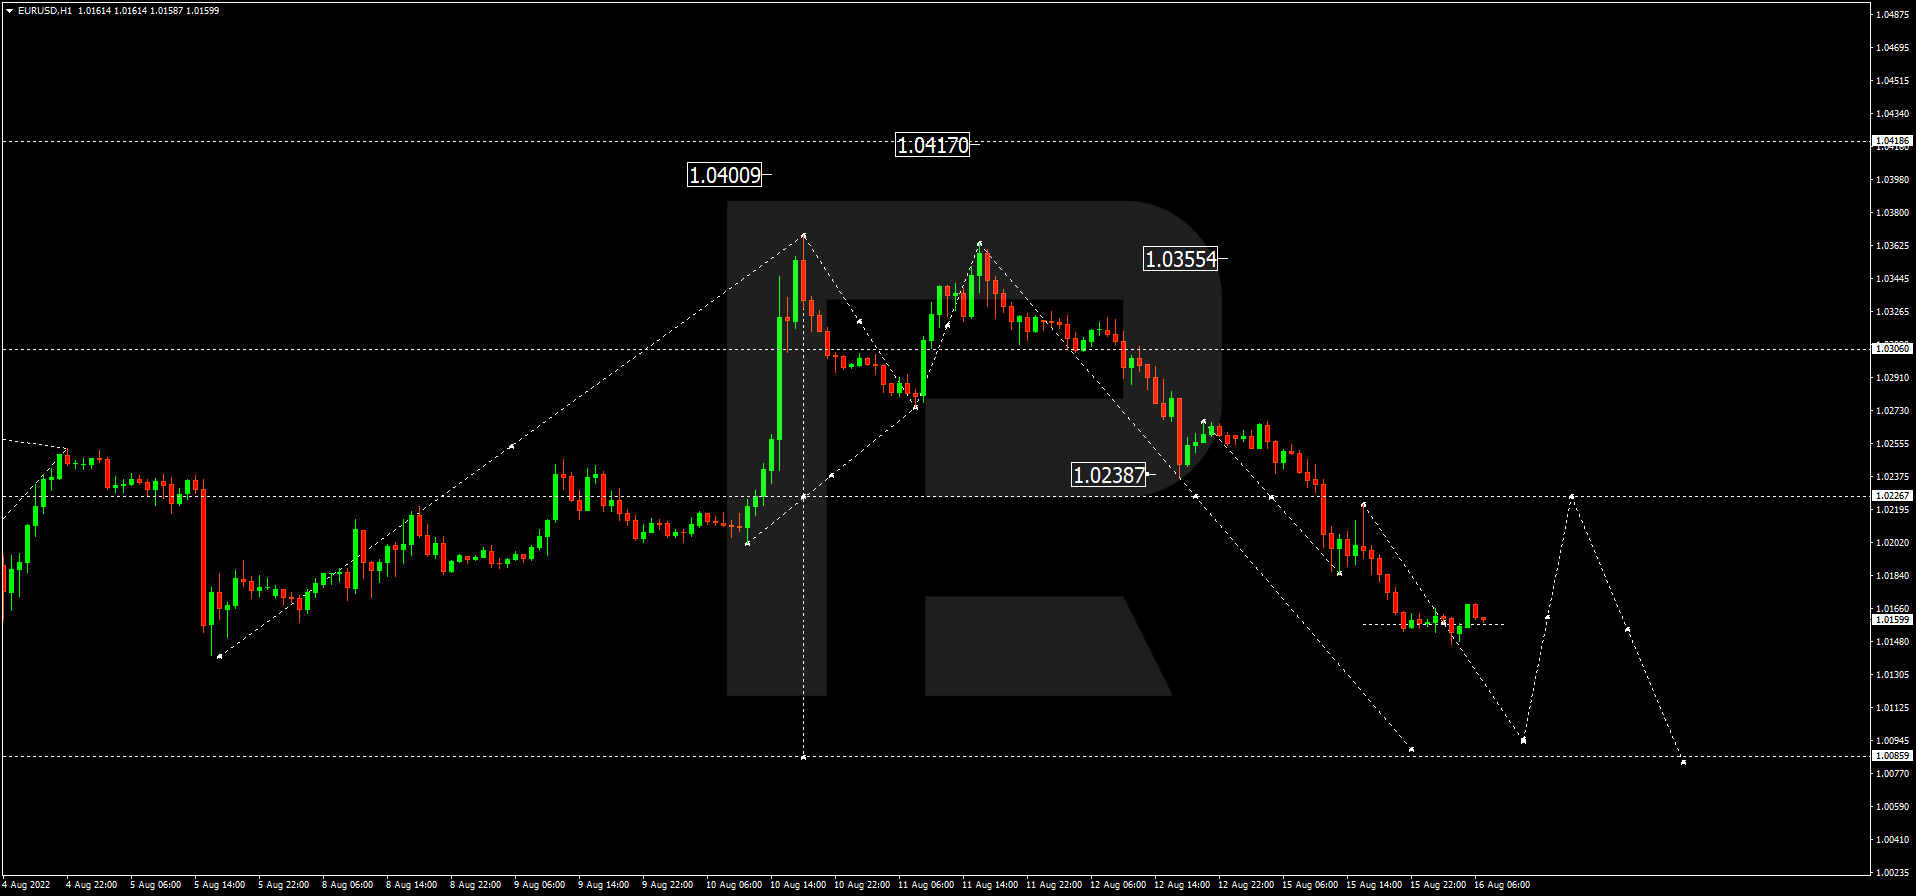
EUR/USD, “Euro vs US Dollar”
Having completed the descending wave at 1.0160, EURUSD is consolidating there. If later the price breaks the range to the upside, the market may form one more ascending wave to reach 1.0222, and then start another decline with the target at 1.0080; if to the downside – resume falling towards 1.0095, or even extend this structure to reach the above-mentioned target.
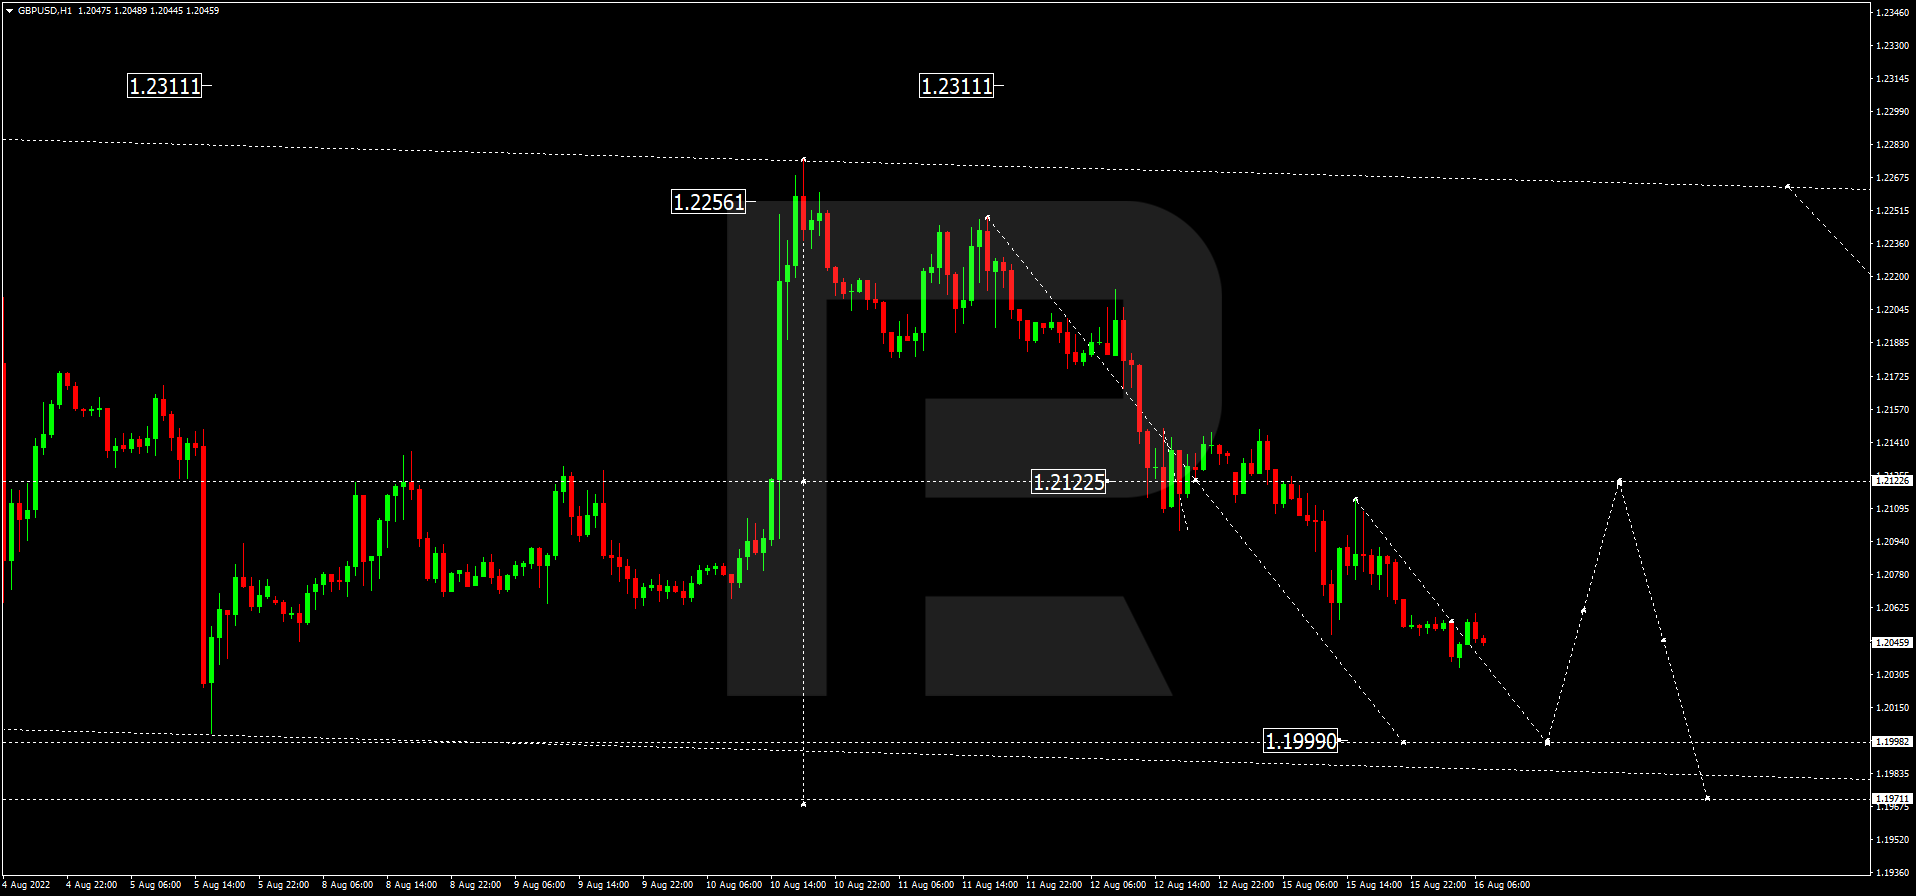
GBP/USD, “Great Britain Pound vs US Dollar”
After finishing the descending wave at 1.2055, GBPUSD is consolidating around this level. If later the price breaks the range to the downside, the market may form a new descending wave with the target at 1.1990; if to the upside – start another growth towards 1.2122, and then resume falling to reach the above-mentioned target.
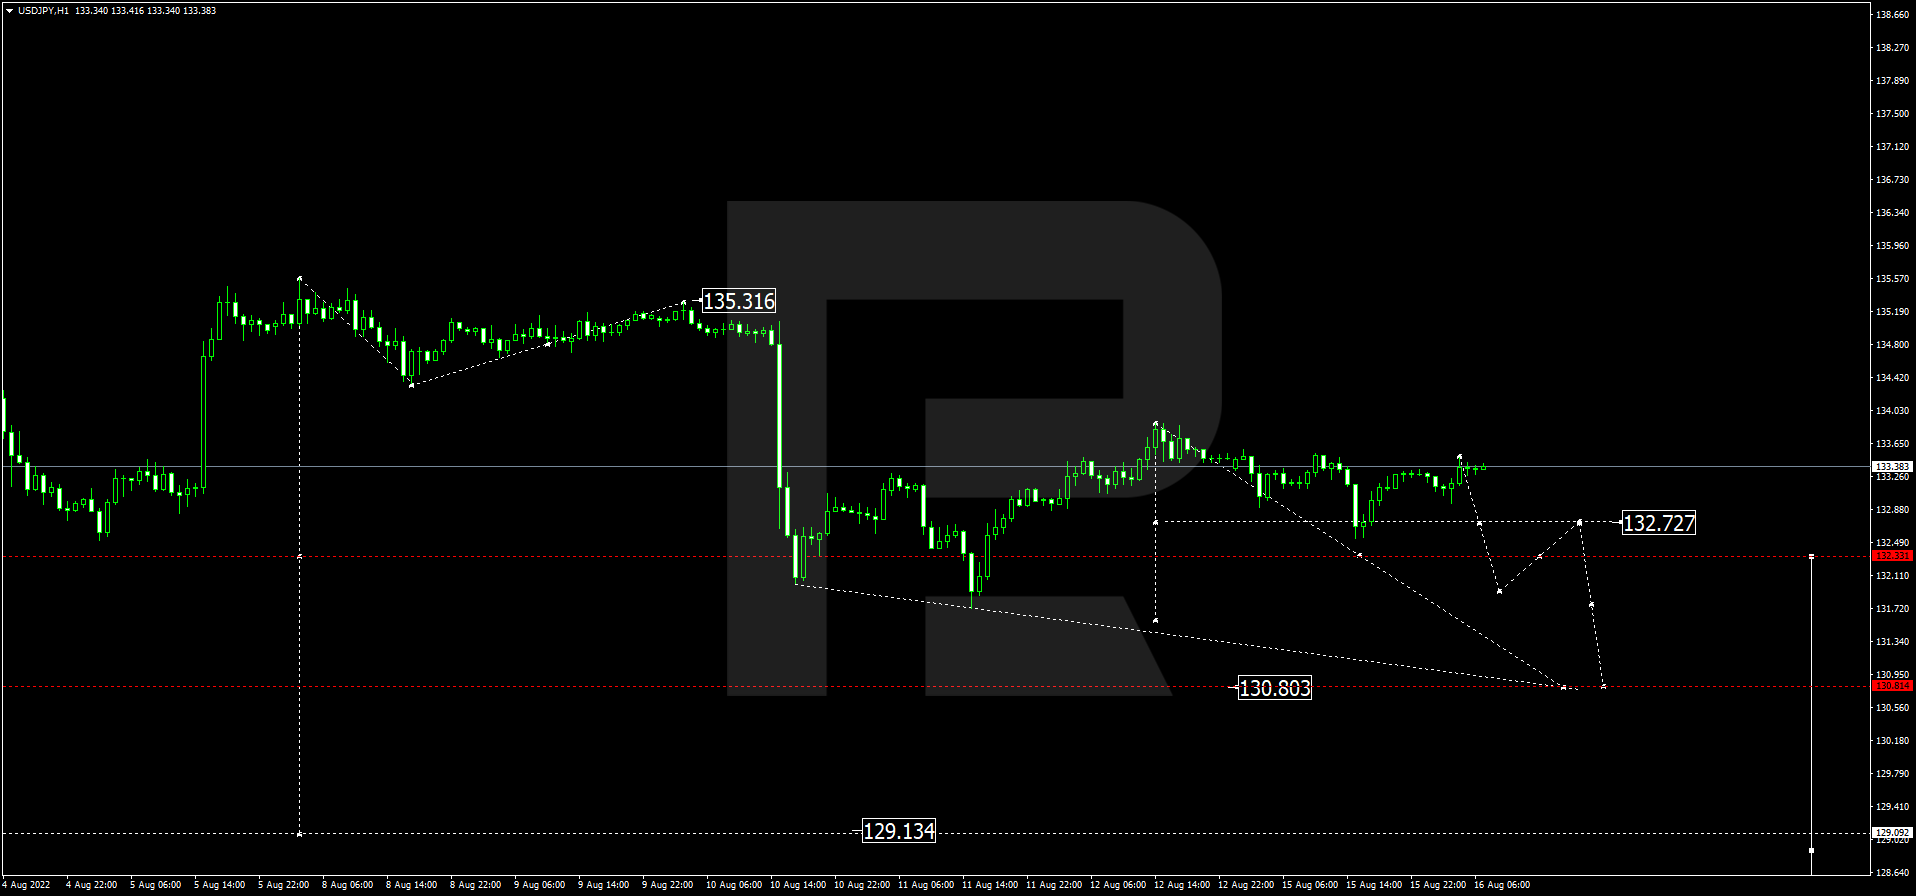
USD/JPY, “US Dollar vs Japanese Yen”
Having completed the descending wave at 132.55 along with the correction up to 133.44, USDJPY is expected to fall towards 130.80 and may later grow to test 132.33 from below, thus forming a wide consolidation range around the latter level. After that, the instrument may start a new decline with the target at 129.13.
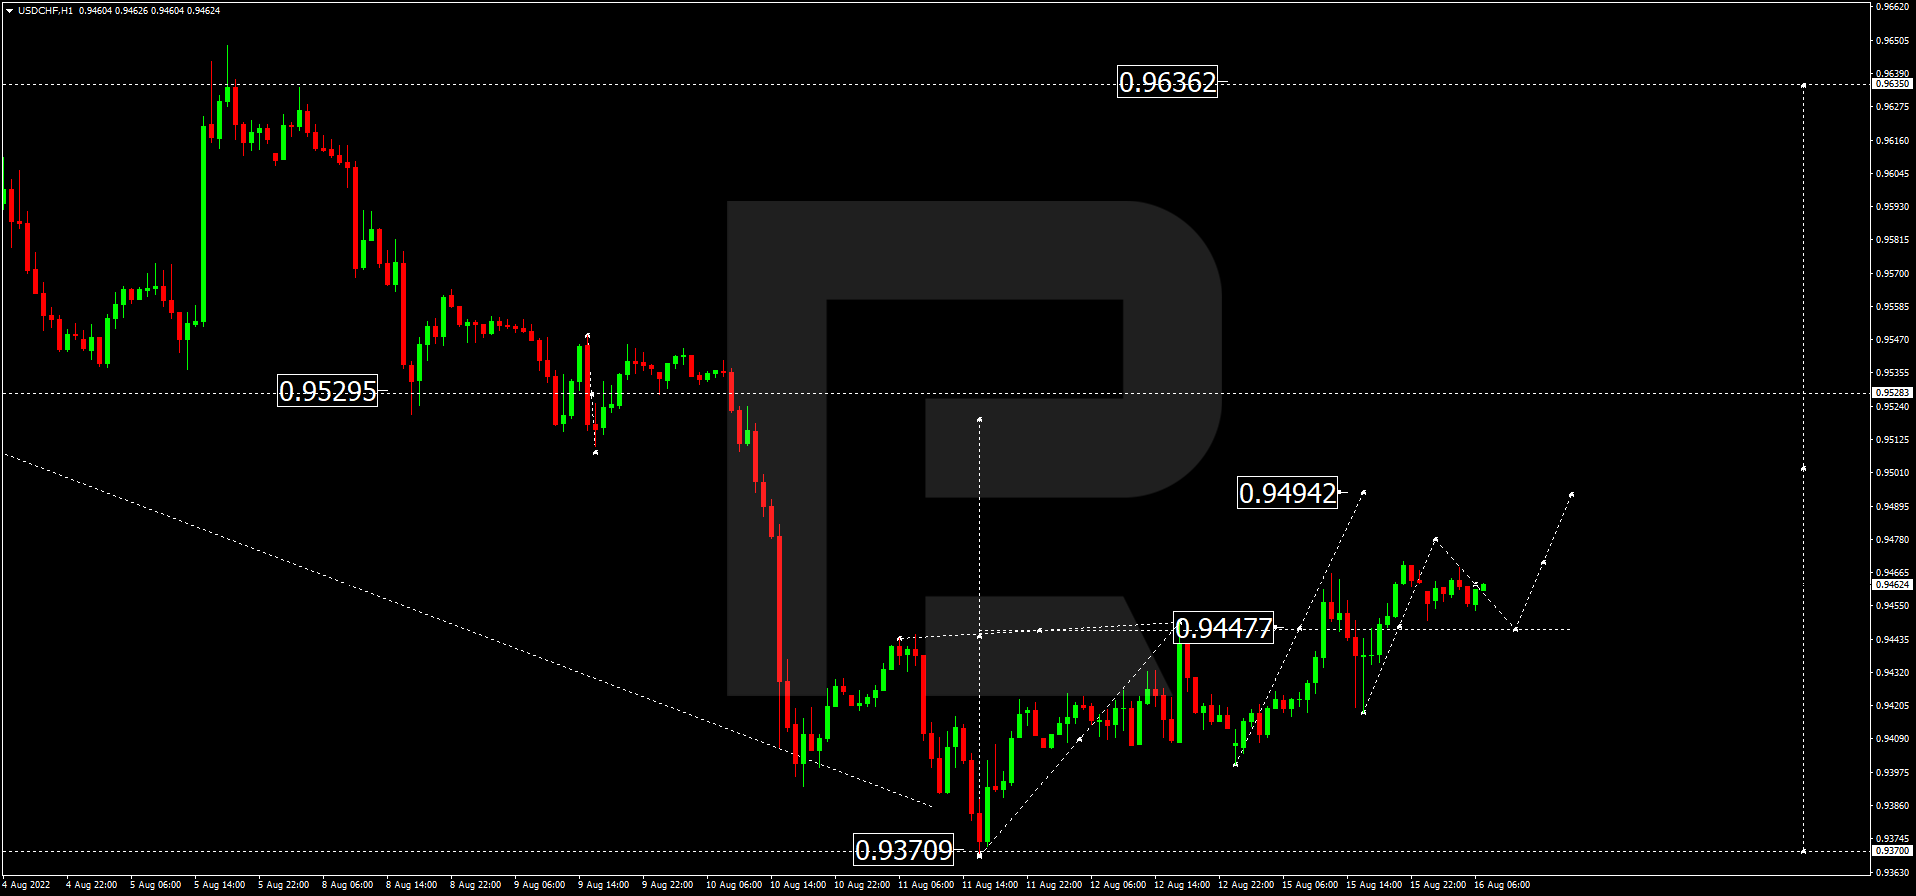
USD/CHF, “US Dollar vs Swiss Franc”
USDCHF is consolidating around 0.9447. If later the price breaks the range to the upside, the market may resume growing with the short-term target at 0.9494. After that, the instrument may correct to return to 0.9447 and then start another growth to reach 0.9500.
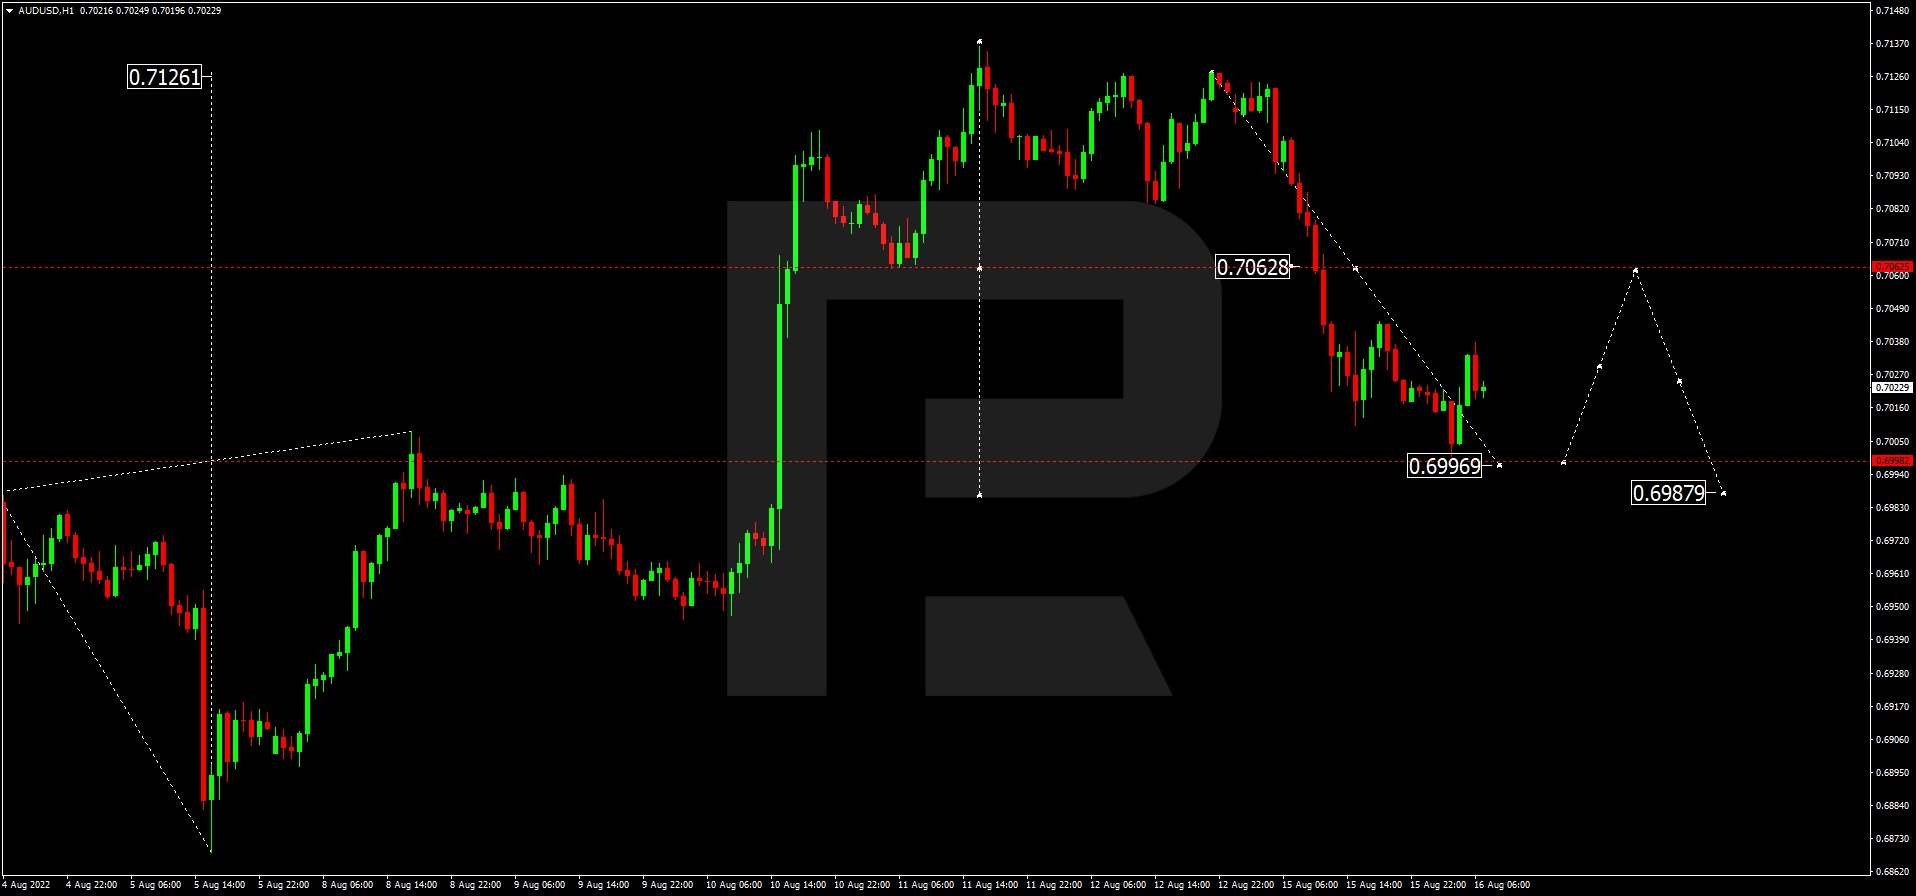
AUD/USD, “Australian Dollar vs US Dollar”
Having completed the descending wave at 0.7000, AUDUSD is expected to consolidate above this level. Possibly, the pair may break the range to the upside and correct up to 0.7060. After that, the instrument may resume falling with the target at 0.6988.
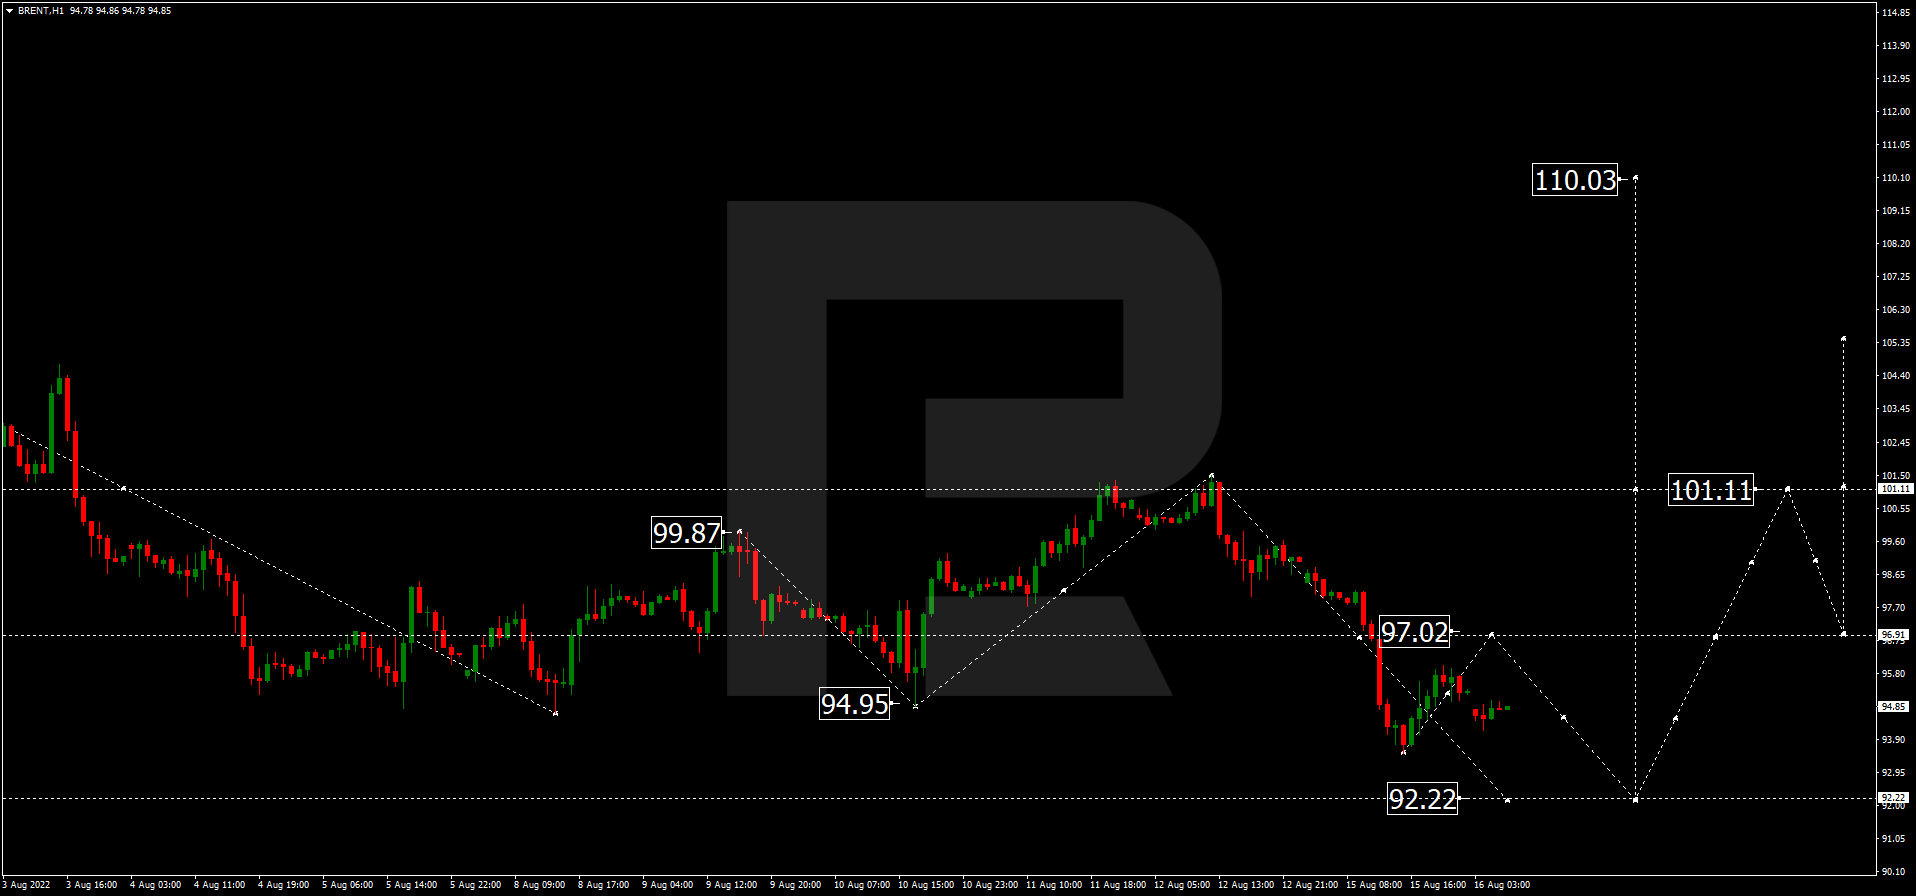
Brent
After rebounding from 101.11, Brent continues forming the descending structure towards 92.22, at least. Later, the market may resume trading upwards to return to 101.11, or even extend this structure up to 110.00.
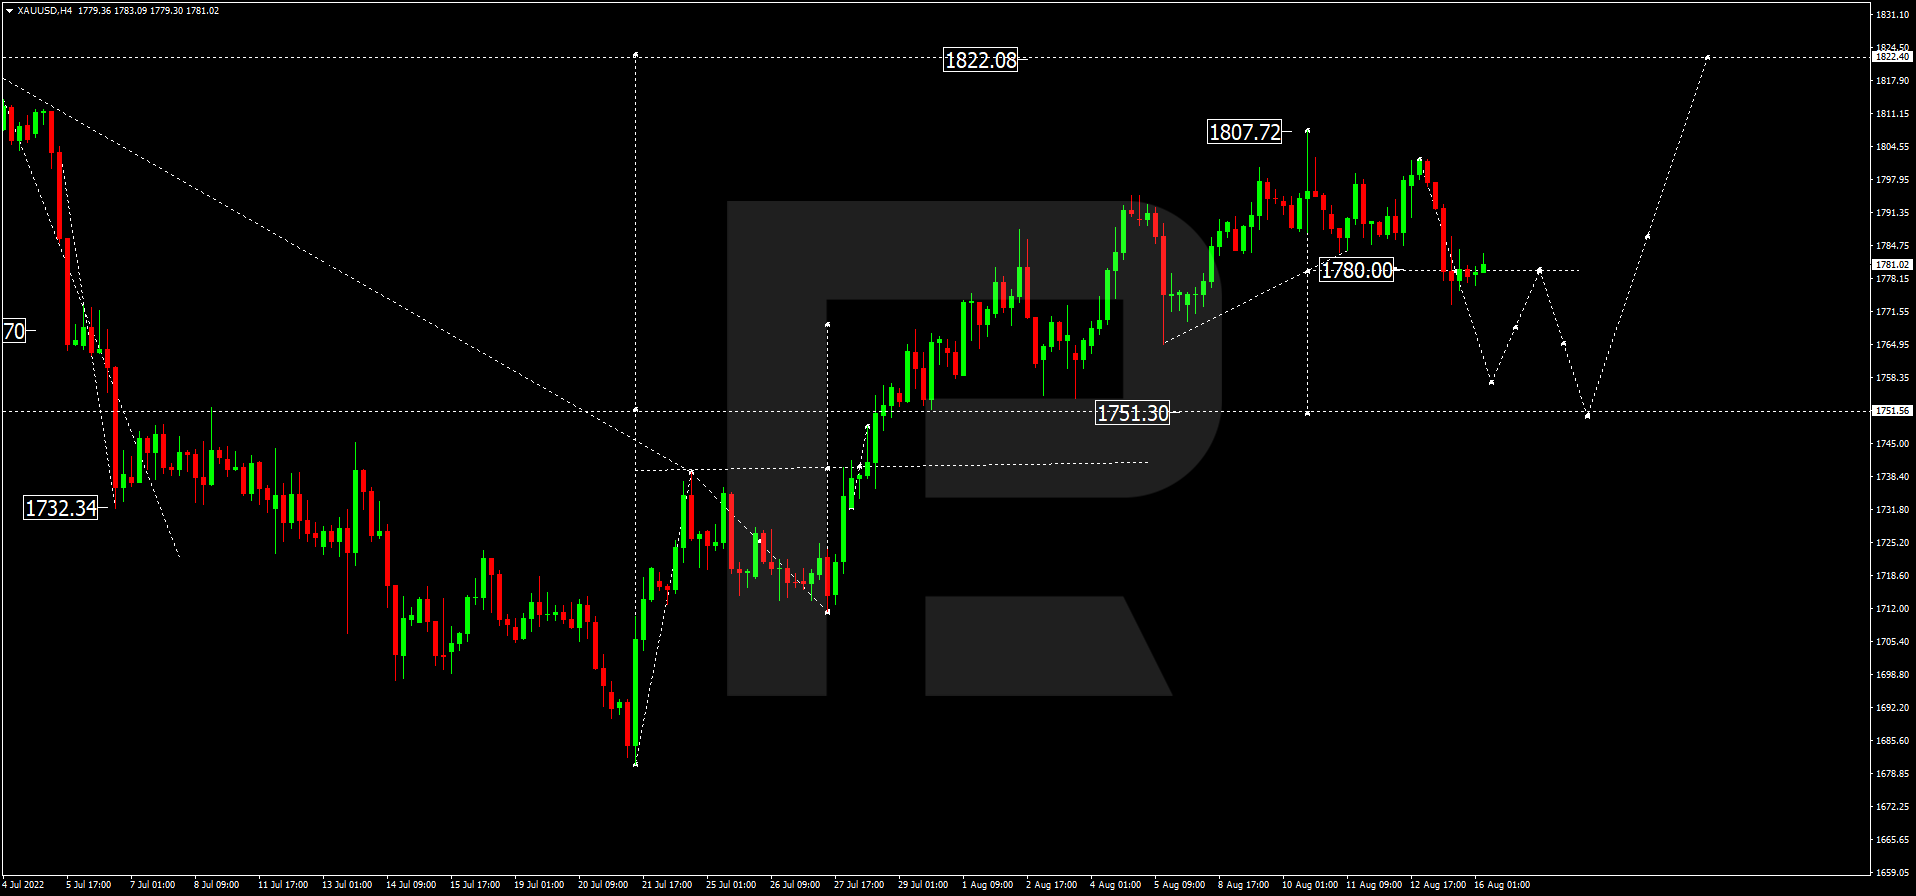
XAU/USD, “Gold vs US Dollar”
Gold has finished the descending wave at 1780.00; right now, it is consolidating there. Possibly, today the metal may break the range to the downside and start a new decline towards 1751.30, or even extend this correction down to 1740.40.
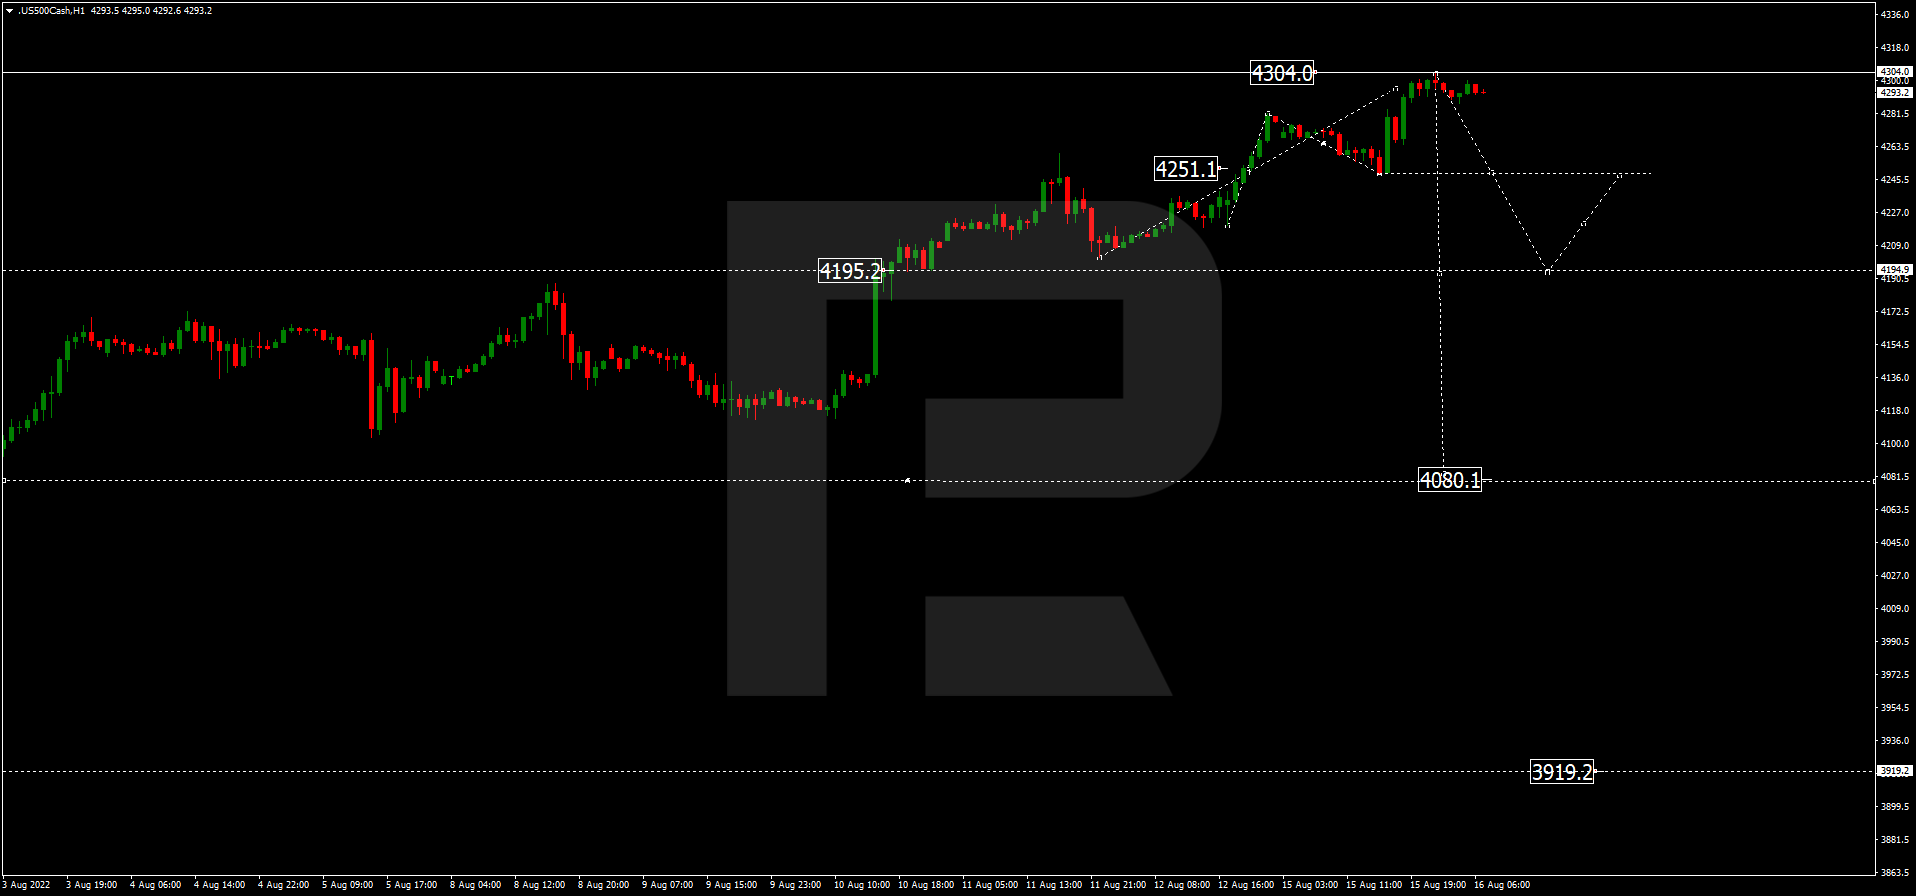
S&P 500
The S&P index has completed the ascending wave at 4303.0; right now, it is consolidating below this level. If later the price breaks the range to the downside, the market may start a new decline with the target at 4194.0, or even extend this structure down to 4080.0.
Author

RoboForex Team
RoboForex
RoboForex Team is a group of professional financial experts with high experience on financial market, whose main purpose is to provide traders with quality and up-to-date market information.


