Forex technical analysis and forecast: Majors, equities and commodities
EUR/USD, “Euro vs US Dollar”
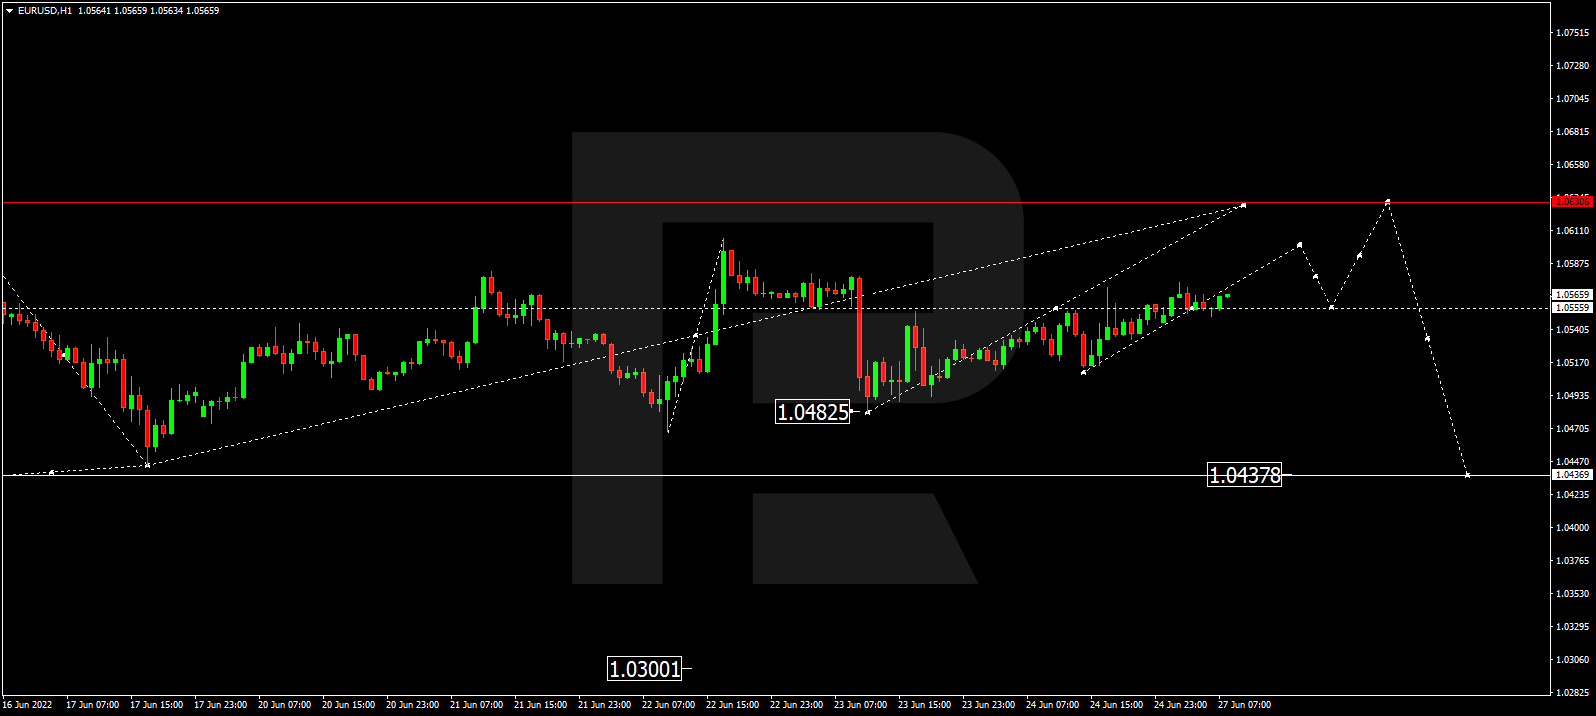
EURUSD is consolidating around 1.0555. Possibly, the pair may form one more ascending structure towards 1.0630. Later, the market may trade downwards to break 1.0550 and then continue falling with the target at 1.0440.
GBP/USD, “Great Britain Pound vs US Dollar”
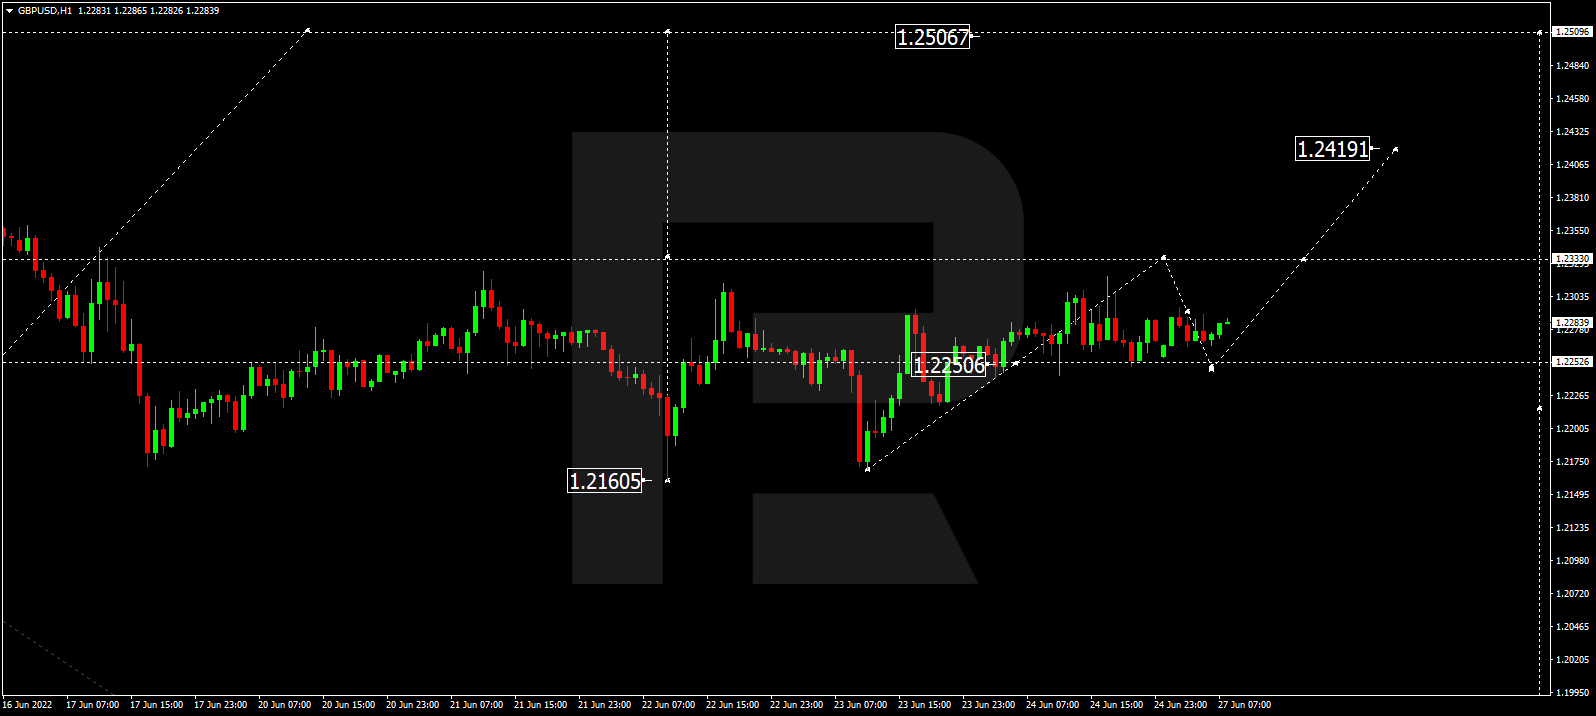
GBPUSD is forming a new consolidation range around 1.2250. Today, the pair may grow towards 1.2330 and then trade downwards to return to 1.2250. If later the price breaks this range to the upside, the market may expand it up to 1.2420; if to the downside – resume falling with the target at 1.2066.
USD/JPY, “US Dollar vs Japanese Yen”
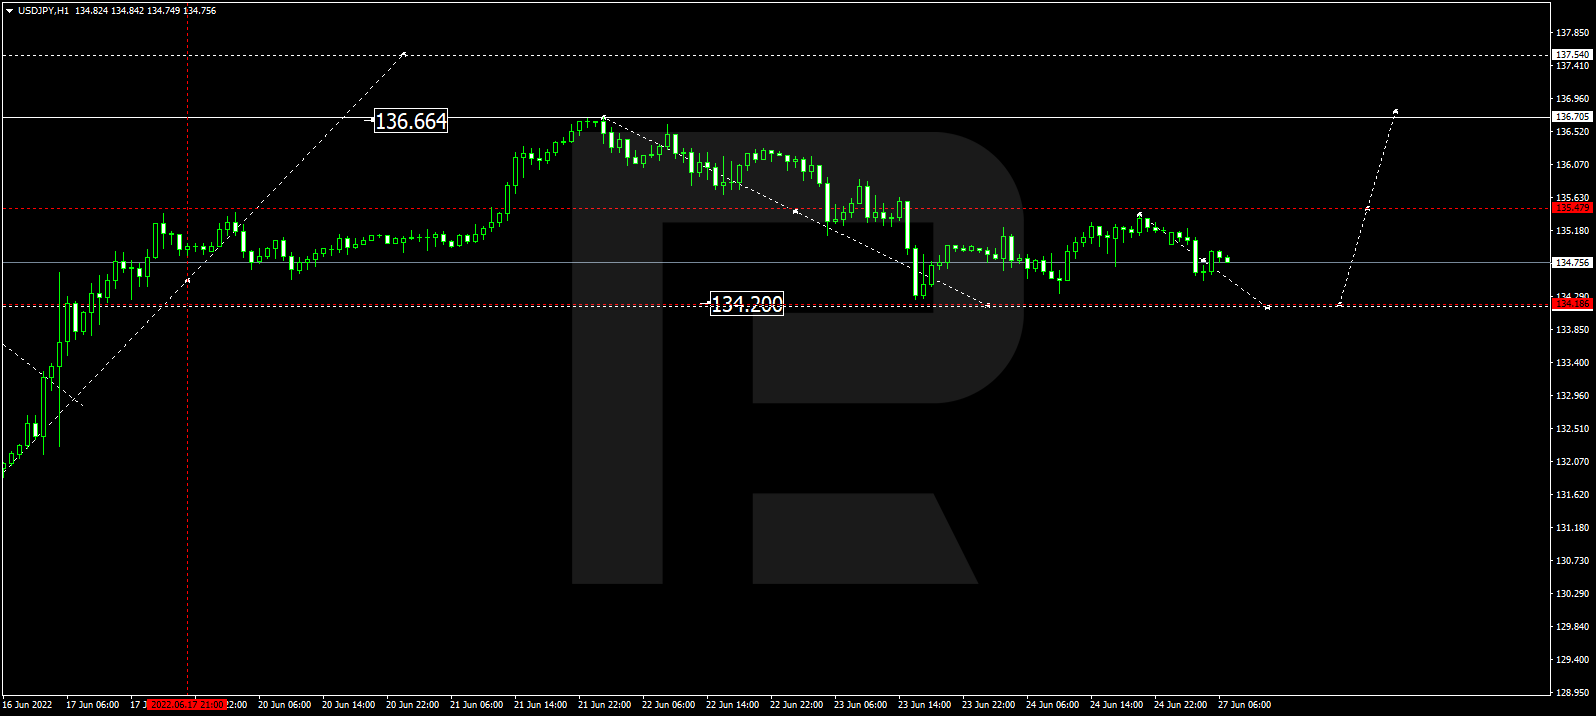
USDJPY has completed the correctional wave at 134.30 and may later start another growth towards 135.50, thus forming a new consolidation range between these two levels. If the price breaks this range to the upside, the market may form one more ascending structure to reach 137.55; if to the downside – resume falling with the target at 134.18.
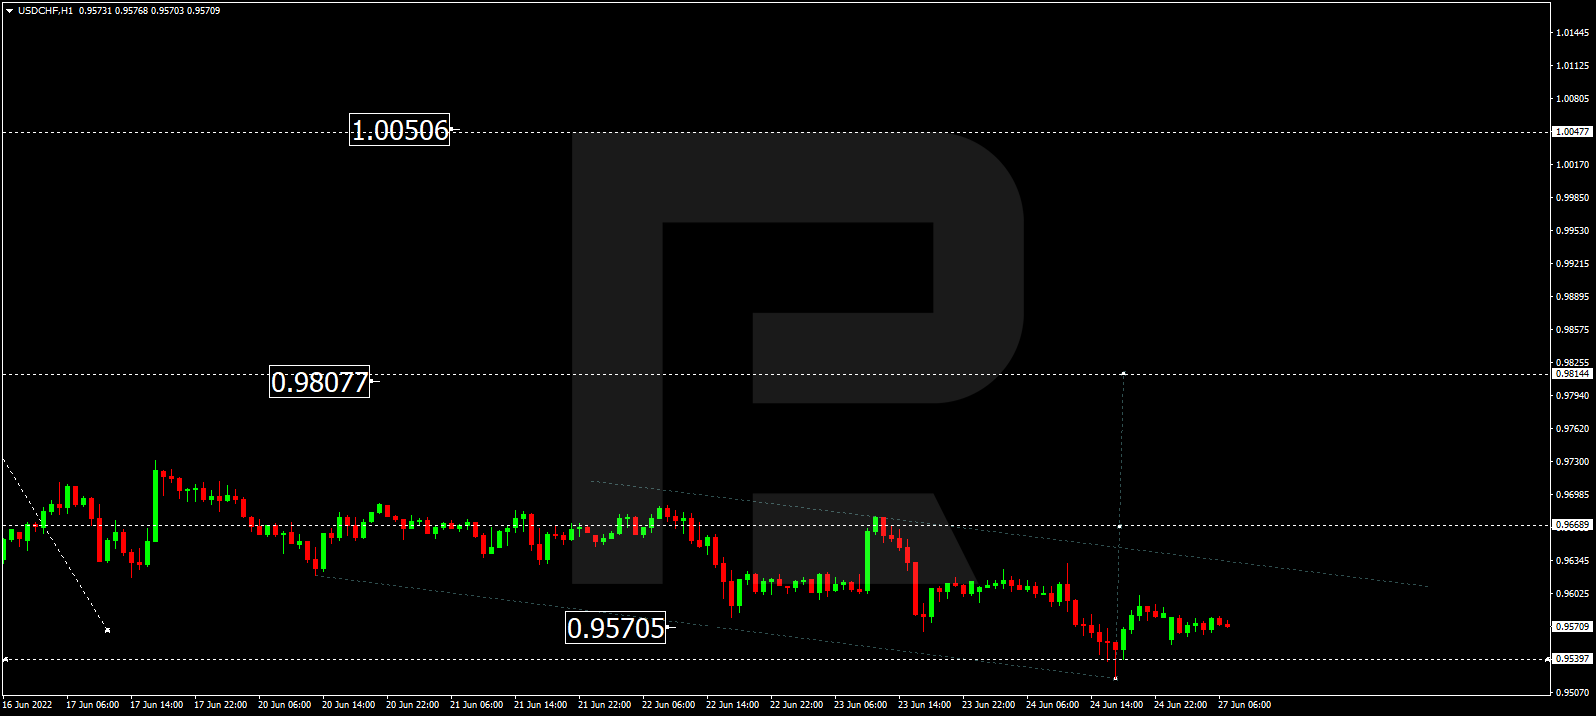
USD/CHF, “US Dollar vs Swiss Franc”
Having finished the descending wave at 0.9540, USDCHF is expected to resume growing to break 0.9666 and may later continue trading upwards with the target at 1.0044.
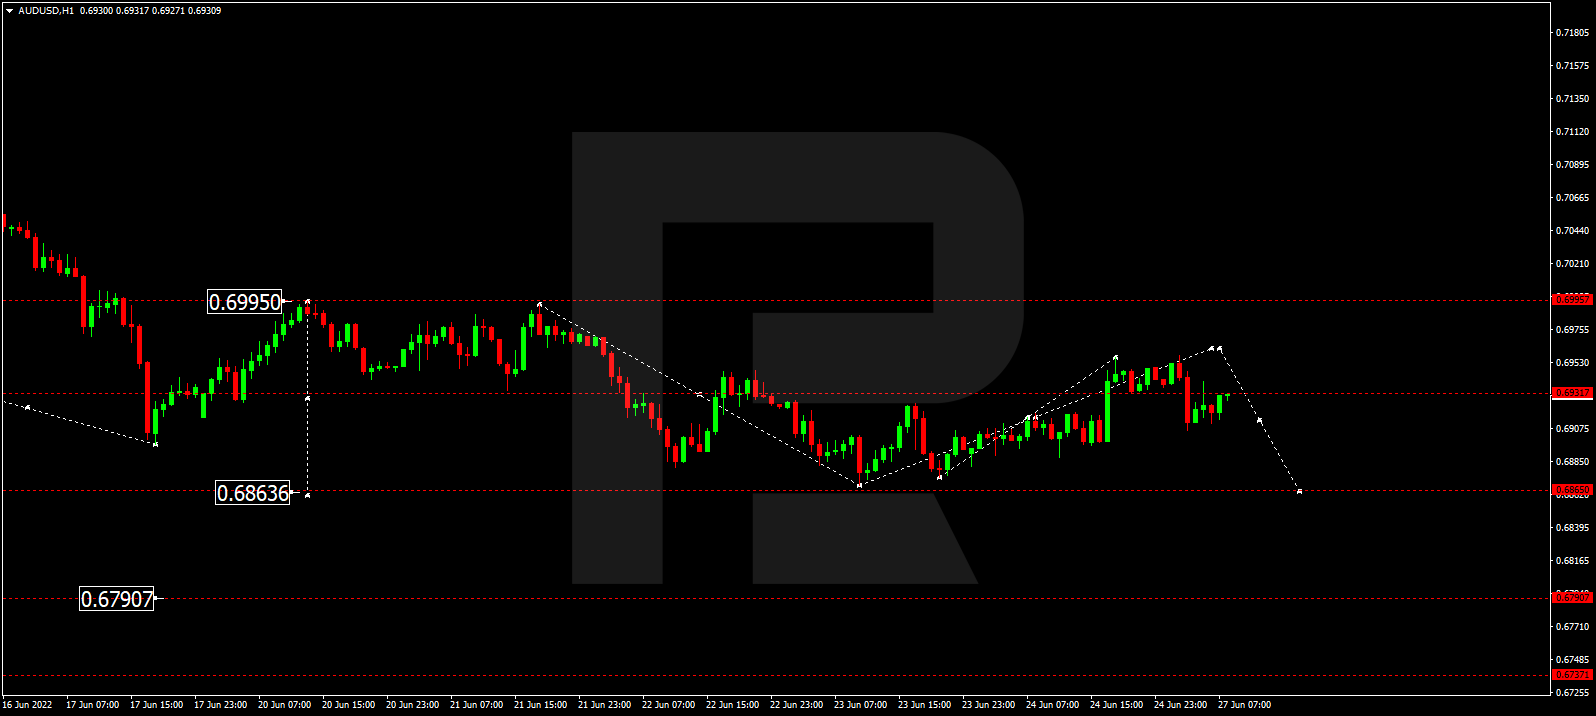
AUD/USD, “Australian Dollar vs US Dollar”
AUDUSD is still consolidating around 0.6910. Possibly, the pair may grow to reach 0.6966 and then resume trading downwards with the target at 0.6866.
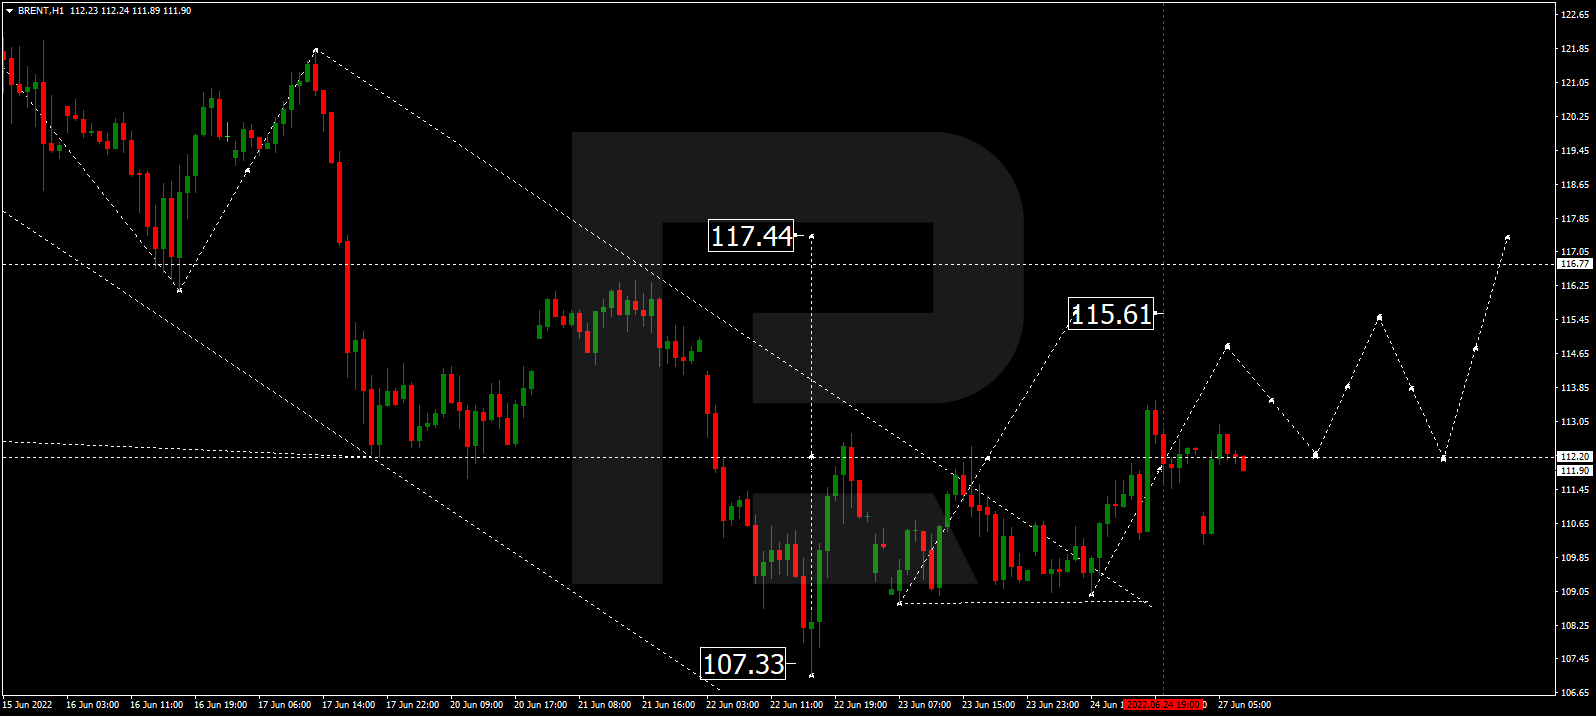
Brent
Having completed the ascending wave 112.60 along with the descending structure towards 110.10, Brent has formed a new consolidation range between these two levels. If the price breaks this range to the upside, the market may form one more ascending structure with the target at 115.50; if to the downside – resume falling towards 105.00 first, and then start another growth to reach 117.00.
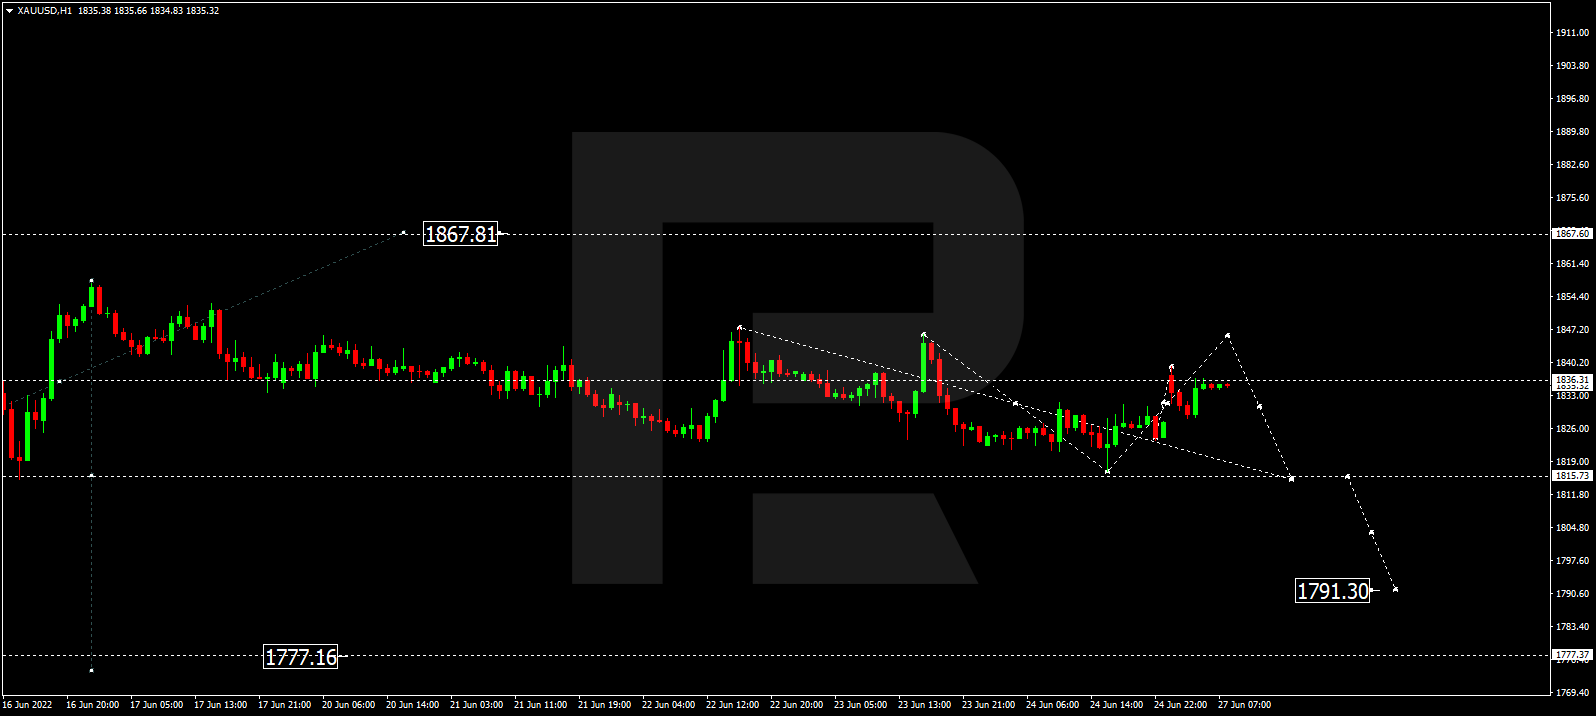
XAU/USD, “Gold vs US Dollar”
Gold is still consolidating around 1836.30. Today, the metal may expand the range up to 1845.50 and then fall to reach 1815.75. If the price breaks this range to the downside, the market may start a new decline with the target at 1790.00 or even extend this structure down to 1777.17; if to the upside – form one more ascending wave to reach 1867.60.
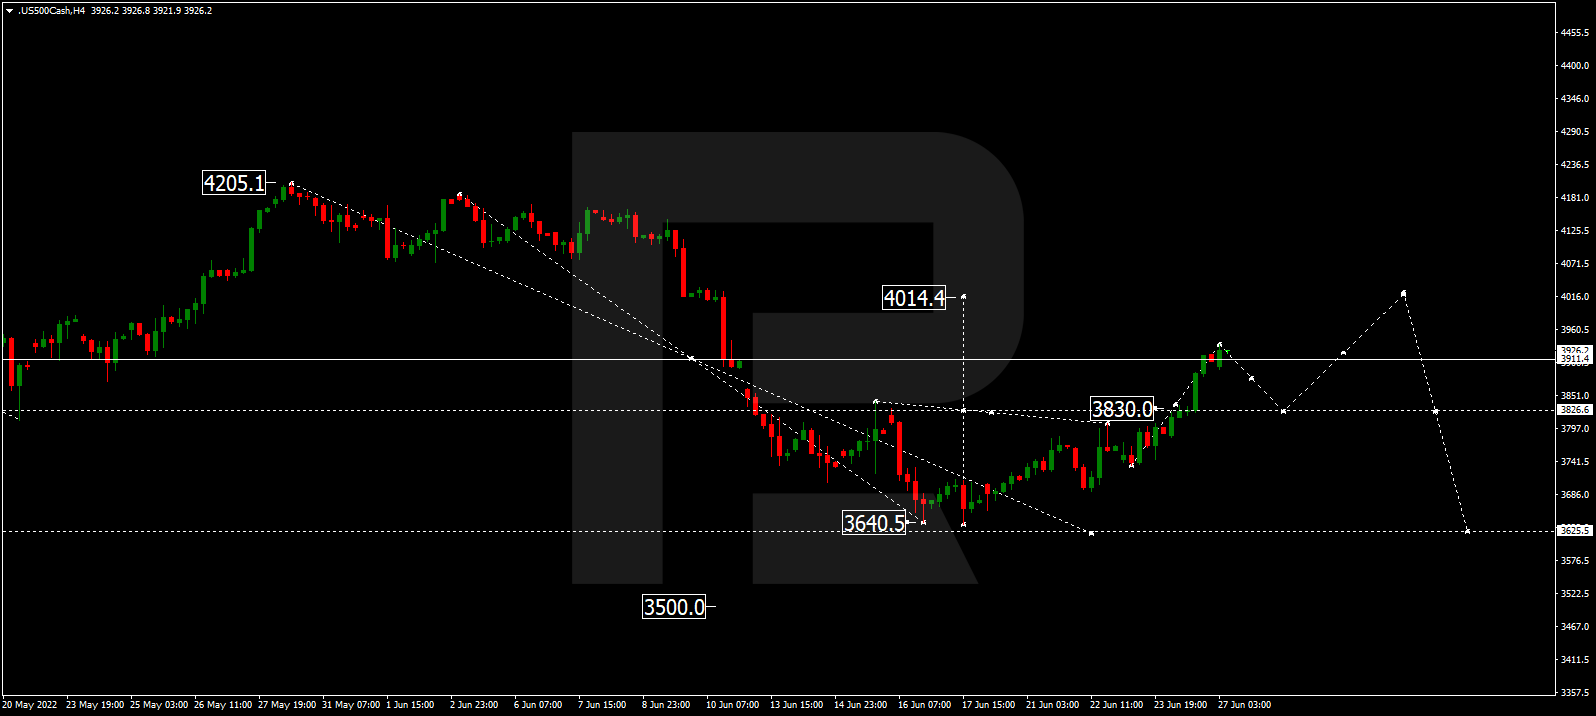
S&P 500
The S&P index has completed the ascending structure at 3935.5 and may later fall towards 3830.0. After that, the instrument may start another growth to reach 4015.5 and then resume trading downwards with the target 3625.5.
Author

RoboForex Team
RoboForex
RoboForex Team is a group of professional financial experts with high experience on financial market, whose main purpose is to provide traders with quality and up-to-date market information.


