Forex Strength and Comparison for Week 43/2016
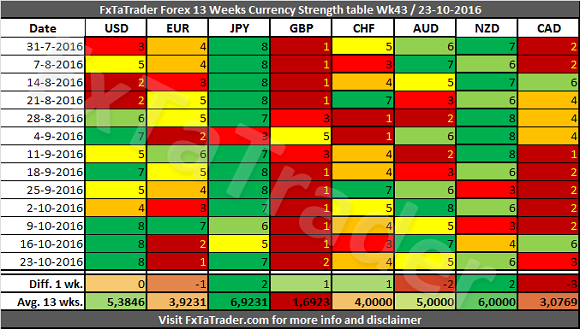
Welcome to my "Strength and Comparison" article for the coming week. The article "Ranking, Rating and Score" has also been published. When looking at the Currency Strength in the table here below we can see that the USD is the strongest currency, the EUR is the weakest and the CAD is back again to the lower range while the NZD is back to the higher range. The USD, JPY and NZD clearly got stronger in the last week and the EUR and CAD weaker. For more details read both of my articles where the relevant Charts and Tables are provided.
______________________________________
13 Weeks Currency Score Strength
The 13 Weeks Currency Strength and the 13 Weeks Average are provided here below. This data and the "13 weeks Currency Classification" are considered for deciding on the preferred range. Because it is not ideal nor desired to change the range for a currency every single week, we perform several checks to avoid this.
-
First of all the strength over a period of the last 13 weeks is considered. See each row for more information.
-
Next the 13 weeks average is considered, see the last row called "Avg. 13 wks."
-
The number of weeks that a currency was stronger than another currency can also be considered.
-
The TA Charts for each Time Frame could also be consulted.
For analyzing the best pairs to trade looking from a longer term perspective the last 13 weeks Currency Classification can be used in support.
This was updated on 25 September 2016 and is provided here for reference purposes:
Strong: USD, JPY, NZD. The preferred range is from 6 to 8.
Neutral: CHF, AUD. The preferred range is from 4 to 5.
Weak: EUR, GBP, CAD. The preferred range is from 1 to 3.
The USD(Strong) has an average score higher but close to the AUD(Neutral). It had however 7 times a higher score in the last 13 weeks so it is clearly still stronger but may become a Neutral currency. This was avoided last weeks because of the high score of 8 in these last 3 weeks.
The EUR(Weak) has an average score lower but close to the CHF(Neutral). It had only 5 times a higher score in the last 13 weeks so it is clearly the weaker currency. The EUR however is more in the range of the Neutral currencies than the Weak currencies. Because of the low score of last 2 weeks it remains a Weak currency for now. This currency will be monitored closely in the coming weeks and may become a Neutral currency.
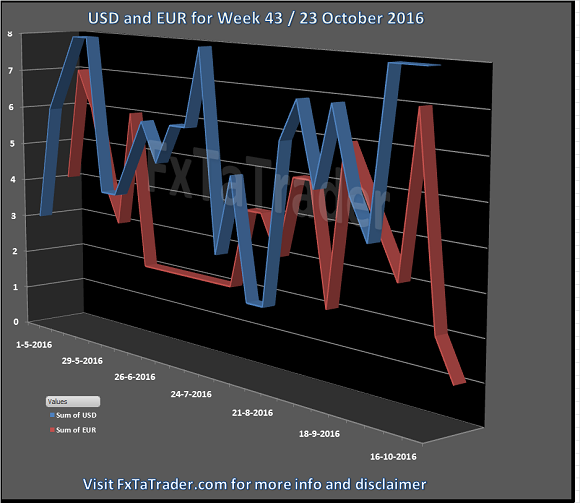
Here below you can see the Weekly Currency Score Chart of the USD and EUR with 6 months data as a reference.
_____________________________________
The USD and EUR
As can be seen the USD is back to the higher range of the strong currencies. However, in the months of July, August and September it was in the range of the Neutral currencies. For the EUR it is the other way around. It was also in the Neutral range in the same period but it is now back to the range of the Weak currencies. That is the reason why both currencies are having an Average 13 Weeks Score near to the Neutral currencies AUD and CHF.
When looking at the TA Charts of this combination there is a clear direction with momentum and that is why this pair is also in the list of the longer term trade based on the Technical Analysis (TA) of the Daily and Weekly chart, see the bottom of this article for more information. As long as the currencies remain in their current range or only one of the 2 currencies goes to the Neutral range the momentum may still be good.
_____________________________________
Currency Score Comparison
"Comparison table" and the "Ranking and Rating list"
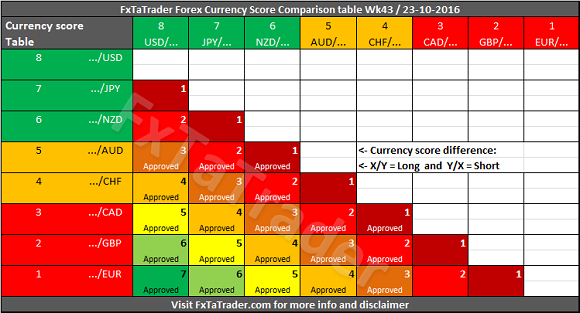
The Forex Currency Comparison Table compares each currency with its counterpart based on the Currency Score. For more information about the currency Score of this week you can read the article "Forex Ranking, Rating and Score" which is published every week together with this article.
By using the comparison table directly below you can get a view without the volatility and statistics as opposed to the "Ranking and Rating list". Only the strength of each currency against the counterparts is analyzed by using the Technical analysis charts of the 4 Time Frames that are also used for the "Ranking and Rating List".
The information from the Comparison Table is the source for calculating the "Ranking and Rating List" where this list additionally uses the volatility and statistics for creating the best and worst performer in the list from number 1 to 28.
"Comparison table" and the "Currency Score Chart"
The additional value of this table compared to the Currency Score table is that the Comparison Table compares the strength between the currencies of each pair. By subtracting the strength of the weaker currency from the stronger currency we have a way to compare each pair combination.
The comparison table provides a way to compare currencies from a longer term perspective of 13 weeks and also simultaneously taking the current trend into account. By coloring the currencies in the X and Y axis according to their Classification we can show what the best combinations are. In doing this we apply 2 rules to make it clearer.
-
First of all only better classified currencies in combination with weaker classified currencies are "Approved" when there is a Currency Score difference of at least 1 in the current week.
-
The only exception is when 2 currencies are similarly classified but the Currency Score difference is equal to or more than 4.
-
It means that each currency should be as far apart from each other as possible in the range from 1 to 8. The classification of the currencies in question may change in the longer term. By using the difference of 4 which is exact at the half of the range it seems a safe approach for trading 2 currencies which are similarly classified.
-
Even though currencies may be in the same classification a currency may be in a weaker/stronger period and may even change its classification in the future. See the current classification for the coming period at the beginning of this article.
______________________________________
Putting the pieces together
Based on the last "13 Weeks currency classification" and the "Currency Comparison Table" the most interesting currencies for going long seem to be the:
USD, JPY and NZD.
These are Strong or Neutral currencies from a longer term perspective when looking at the last "13 Weeks currency classification".
For going short the same analysis can be done and the following currencies seem to fit best:
EUR, GBP and CAD.
These are Weak or Neutral currencies from a longer term perspective.
Currencies with a high deviation seem less interesting to trade because they are less predictable. There are no deviating currencies for this week. See the Strength and Compariosn table for more information.
Some of the pairs in the "Currency Comparison Table" comply for a longer term trade based on the Technical Analysis (TA) of the Daily and Weekly chart. For the coming week these seem to be: GBP/JPY, GBP/USD, EUR/USD, EUR/JPY, GBP/AUD, GBP/NZD, EUR/NZD, EUR/AUD, USD/CHF and NZD/CAD.
______________________________________
Besides this article I also use the Forex "Ranking, Rating and Score" which is also available once a week on my blog. In the article "Ranking, Rating and Score" we look in more detail at the absolute position of the currencies and pairs.
It is recommended to read the page Currency score explained and Models in practice for a better understanding of the article. If you would like to use this article then mention the source by providing the URL FxTaTrader.com or the direct link to this article. Good luck in the coming week.
______________________________________
DISCLAIMER: The articles are my personal opinion, not recommendations, FX trading is risky and not suitable for everyone.The content is for educational purposes only and is aimed solely for the use by ‘experienced’ traders in the FOREX market as the contents are intended to be understood by professional users who are fully aware of the inherent risks in forex trading. The content is for 'Forex Trading Journal' purpose only. Nothing should be construed as recommendation to purchase any financial instruments. The choice and risk is always yours. Thank you.
Author

Frank Oznar
FxTaTrader
Technical Analysis of the trading markets has fascinated me since the early 1990's. I was then about 25 years old. During the years my studies and work made it possible to look into Technical analysis from an economic and a scientific point of view.


