Forex market outlook – Monthly charts analysis

This analysis is based on the provided monthly charts for the following major currency pairs: USD/JPY, NZD/USD, GBP/USD, EUR/USD, and AUD/USD. The charts incorporate candlestick patterns, Bollinger Bands, and a Z-score momentum indicator to assess potential long-term trends and key levels.
Key indicators
Candlestick Patterns: Used to identify potential reversals and continuations of price trends.
Bollinger Bands: A volatility indicator that helps identify potential overbought or oversold conditions and price breakouts.
Z-Score Momentum Indicator: Measures how far current price momentum deviates from its average. A high positive Z-score suggests strong upward momentum (potentially overbought), while a low negative Z-score indicates strong downward momentum (potentially oversold).
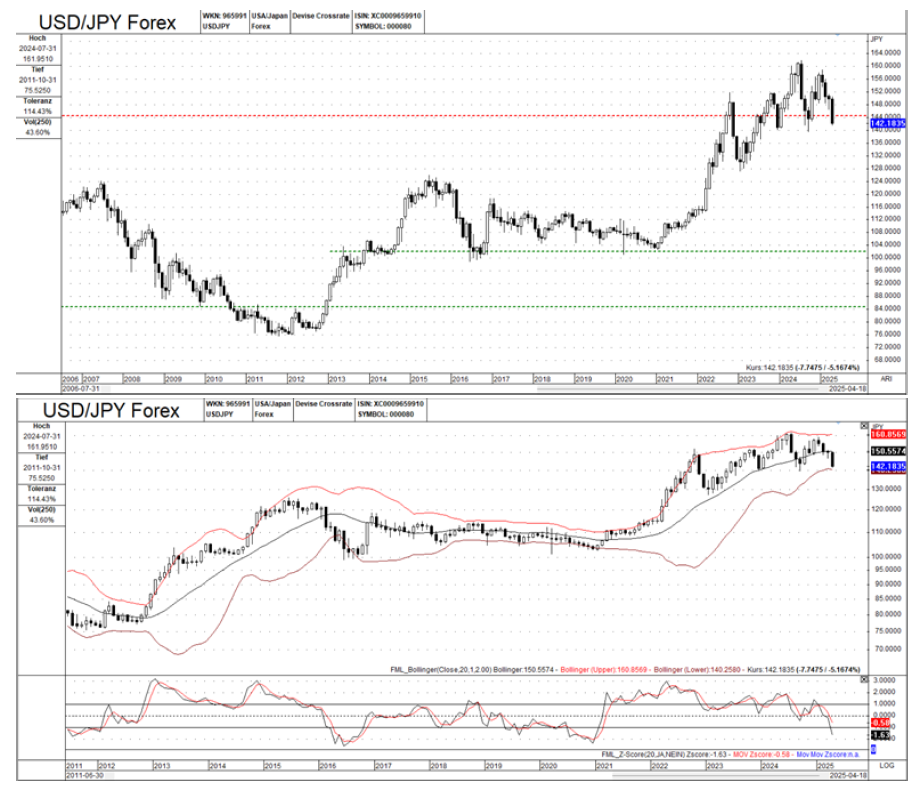
USD/JPY (US Dollar / Japanese Yen)
Long-Term Trend: Strong long-term uptrend.
Key levels: Support around 142.193, 100.00, and 80.00. Resistance around 160.00.
Bollinger Bands: Price consolidating near the middle band.
Z-Score Momentum Indicator: Shows a recent dip, indicating slowing upward momentum.
Overall Analysis: The slowing Z-score momentum supports the idea of a potential pullback. If the Z-score continues to decline while the price remains near the middle Bollinger Band, a test of the 142.193 support level becomes more likely. The overall bullish trend is still in place, but traders should watch for confirmation of the momentum shift.
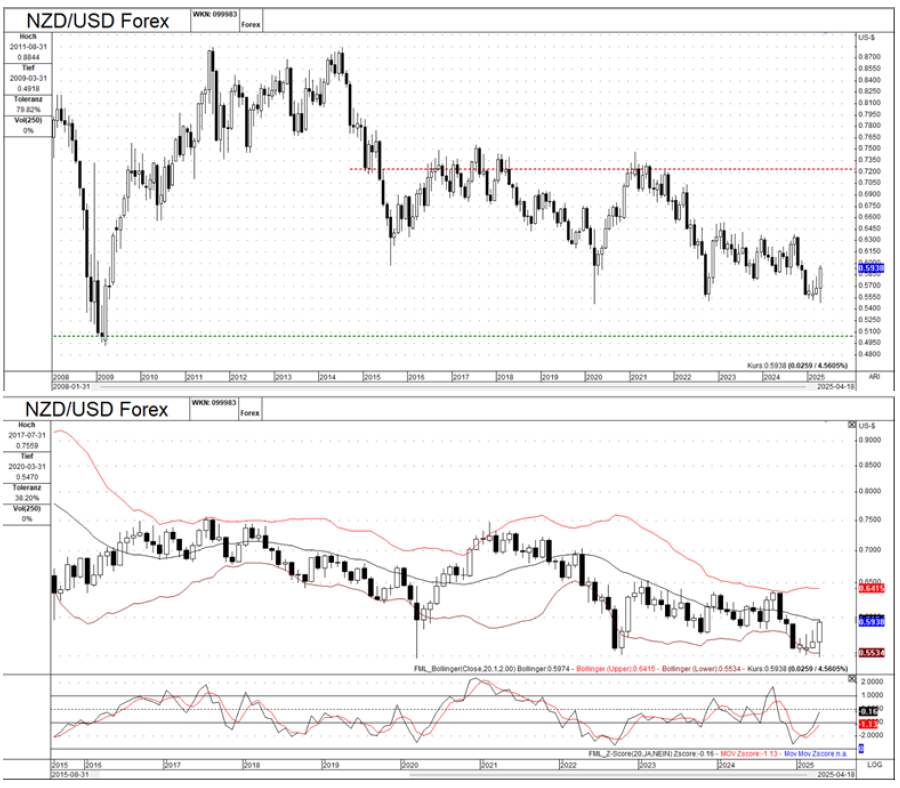
NZD/USD (New Zealand Dollar / US Dollar)
Long-Term Trend: Long-term downtrend.
Key Levels: Support around 0.5338 and 0.4950. Resistance around 0.7200.
Bollinger Bands: Price below the middle band.
Z-Score Momentum Indicator: Showing signs of upward movement, suggesting a potential short-term correction.
Overall Analysis: The rising Z-score suggests a potential correction within the downtrend. However, as long as the Z-score remains below the zero line and the price stays below the middle Bollinger Band, the bearish bias remains. Traders should be cautious of chasing the upward move and look for potential selling opportunities at resistance levels.
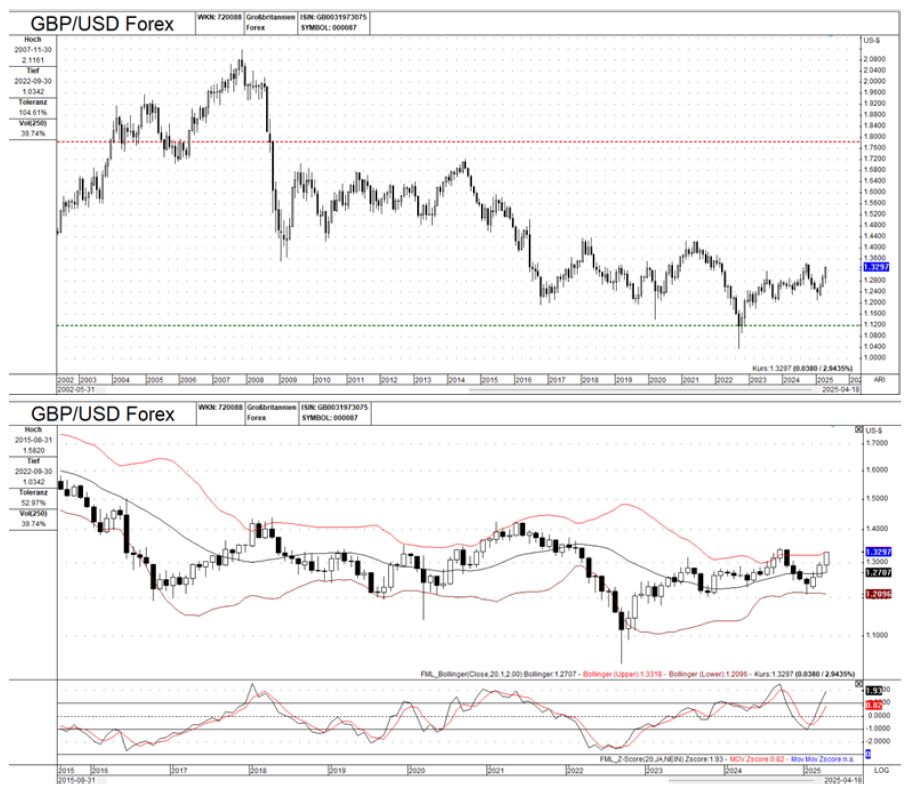
GBP/USD (Great Britain Pound / US Dollar)
Long-Term Trend: Volatile, with a downtrend followed by a recovery.
Key Levels: Support around 1.2707 and 1.0400. Resistance around 1.7920.
Bollinger Bands: Price near the upper band, potentially overbought.
Z-Score Momentum Indicator: In overbought territory.
Overall Analysis: The overbought Z-score reinforces the possibility of a pullback. Combined with the price being near the upper Bollinger Band, this suggests that the recent upward move may be losing steam. A correction towards the 1.2707 support is a reasonable expectation.
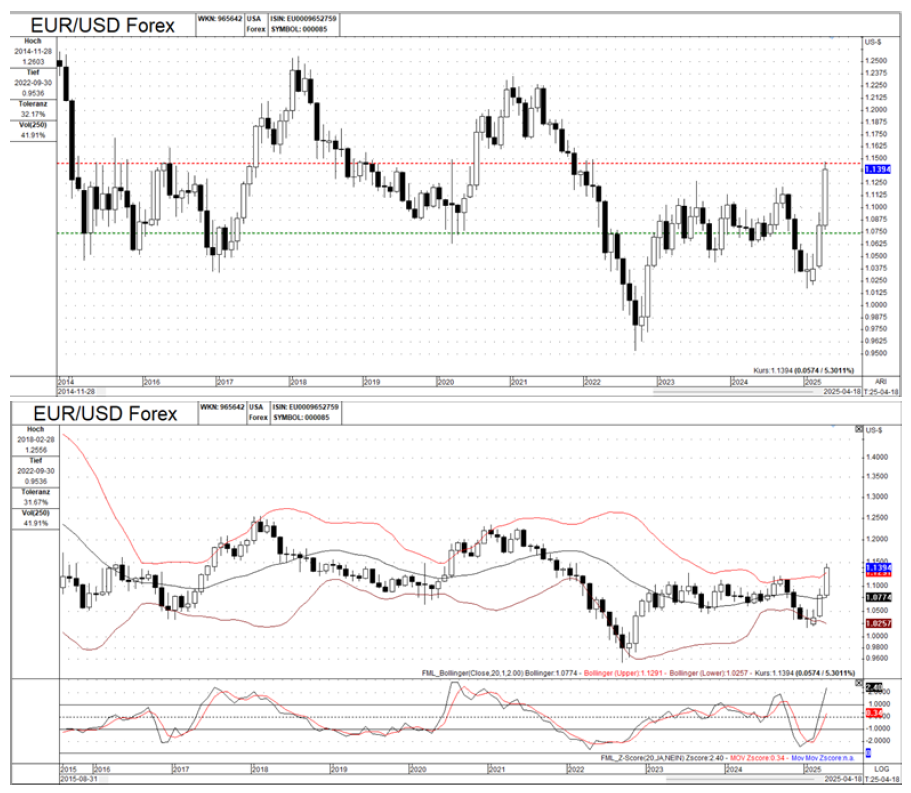
EUR/USD (Euro / US Dollar)
Long-Term Trend: Consolidation within a broader downtrend.
Key Levels: Support around 1.0750 and 1.0257. Resistance around 1.1394.
Bollinger Bands: Price recently moved above the middle band.
Z-Score Momentum Indicator: Showing upward movement.
Overall Analysis: The rising Z-score supports the bullish move above the middle Bollinger Band. This suggests that the consolidation might be breaking to the upside. However, traders should watch if the Z-score starts to decline before the price reaches the 1.1394 resistance. This could be an early warning sign of a failed breakout.
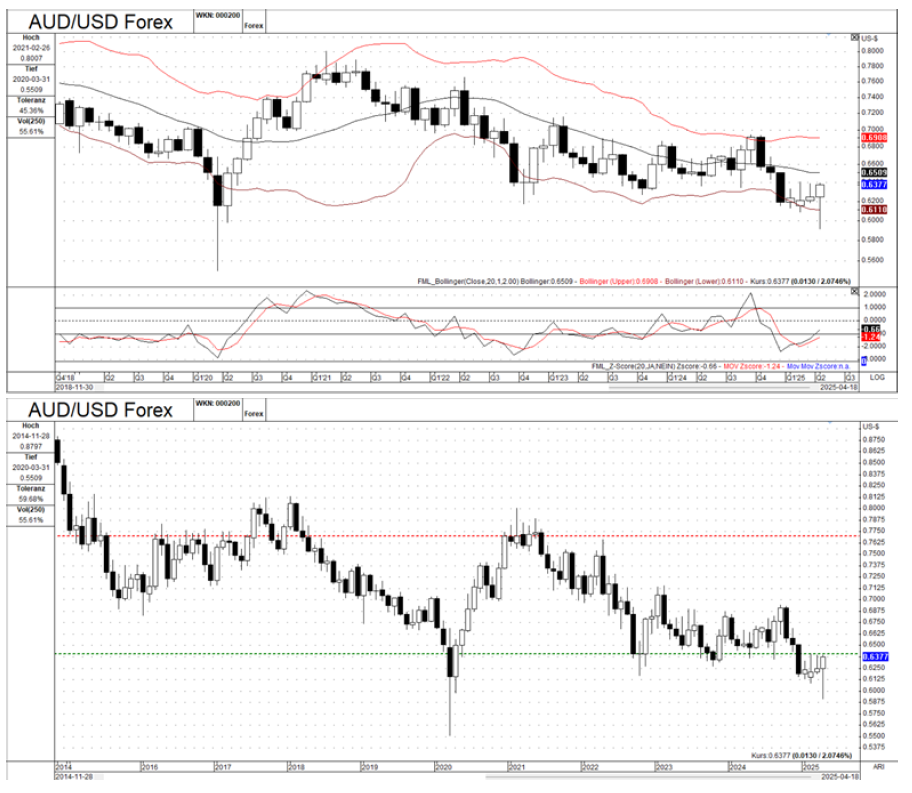
AUD/USD (Australian Dollar / US Dollar)
Long-Term Trend: Downtrend.
Key levels: Support around 0.6377 and 0.6110. Resistance around 0.7675.
Bollinger Bands: Price below the middle band.
Z-Score Momentum Indicator: Coming out of oversold territory.
Overall Analysis: The Z-score's move out of oversold territory suggests a potential corrective bounce. However, the overall downtrend remains in control. Traders should monitor if the Z-score reaches the zero line or crosses above it. A failure to do so would indicate continued bearish momentum, and the price is likely to test the 0.6377 support again.
Author

FxPro Traders Research Team
FxPro Traders
The FxPro Traders Research Team delivers advanced analysis and strategies designed to empower your success in today's dynamic forex markets.


