FOMC day tomorrow: Anticipation builds as the Fed poised to lower interest rates

USD: Sept '24 is Down at 100.33.
Energies: Oct '24 Crude is Up at 69.03.
Financials: The Dec '24 30 Year T-Bond is Up 8 ticks and trading at 127.14.
Indices: The Sept '24 S&P 500 emini ES contract is 60 ticks Higher and trading at 5653.00.
Gold: The Dec'24 Gold contract is trading Down at 2604.40.
Initial conclusion
This is not a correlated market. The USD is Down and Crude is Up which is normal, but the 30 Year T-Bond is trading Higher. The Financials should always correlate with the US dollar such that if the dollar is Higher, then the bonds should follow and vice-versa. The S&P is Higher and Crude is trading Higher which is not correlated. Gold is trading Lower which is not correlated with the US dollar trading Down. I tend to believe that Gold has an inverse relationship with the US Dollar as when the US Dollar is down, Gold tends to rise in value and vice-versa. Think of it as a seesaw, when one is up the other should be down. I point this out to you to make you aware that when we don't have a correlated market, it means something is wrong. As traders you need to be aware of this and proceed with your eyes wide open. Currently Asia is trading Mixed. All of Europe is trading Higher.
Possible challenges to traders
-
Core Retail Sales is out at 8:30 AM EST. This is Major.
-
Retail Sales M/M is out at 8:30 AM EST. This is Major.
-
Capacity Utilization Rate is out at 9:15 EST. This is Major.
-
Industrial Production M/M is out at 9:15 EST. This is Major.
-
Business Inventories is out at 10 AM EST. This is Major.
-
FOMC Member Logan Speaks at 10 AM EST. This is Major.
-
NAHB Housing Market Index is out at 10 AM EST. This is Major.
Traders, please note that we've changed the Bond instrument from the 10 year (ZN) to the 2 year (ZT). They work exactly the same.
We've elected to switch gears a bit and show correlation between the 2-year Treasury notes (ZT) and the S&P futures contract. The YM contract is the Dow Jones Industrial Average, and the purpose is to show reverse correlation between the two instruments. Remember it's likened to a seesaw, when up goes up the other should go down and vice versa.
Yesterday the ZT migrated Lower at 8:30 AM EST with no real economic news released and began its Downward slide. Look at the charts below and you'll see a pattern for both assets. The Dow moved Higher at 8:30 AM and the ZT moved Lower at around the same time. These charts represent the newest version of Bar Charts, and I've changed the timeframe to a 15-minute chart to display better. This represented a Short opportunity on the 2-year note, as a trader you could have netted about 30 ticks per contract on this trade. Each tick is worth $7.625. Please note: the front month for ZT is Dec and the Dow is still Sept '24. I've changed the format to filled Candlesticks (not hollow) such that it may be more apparent and visible.
Charts courtesy of barcharts
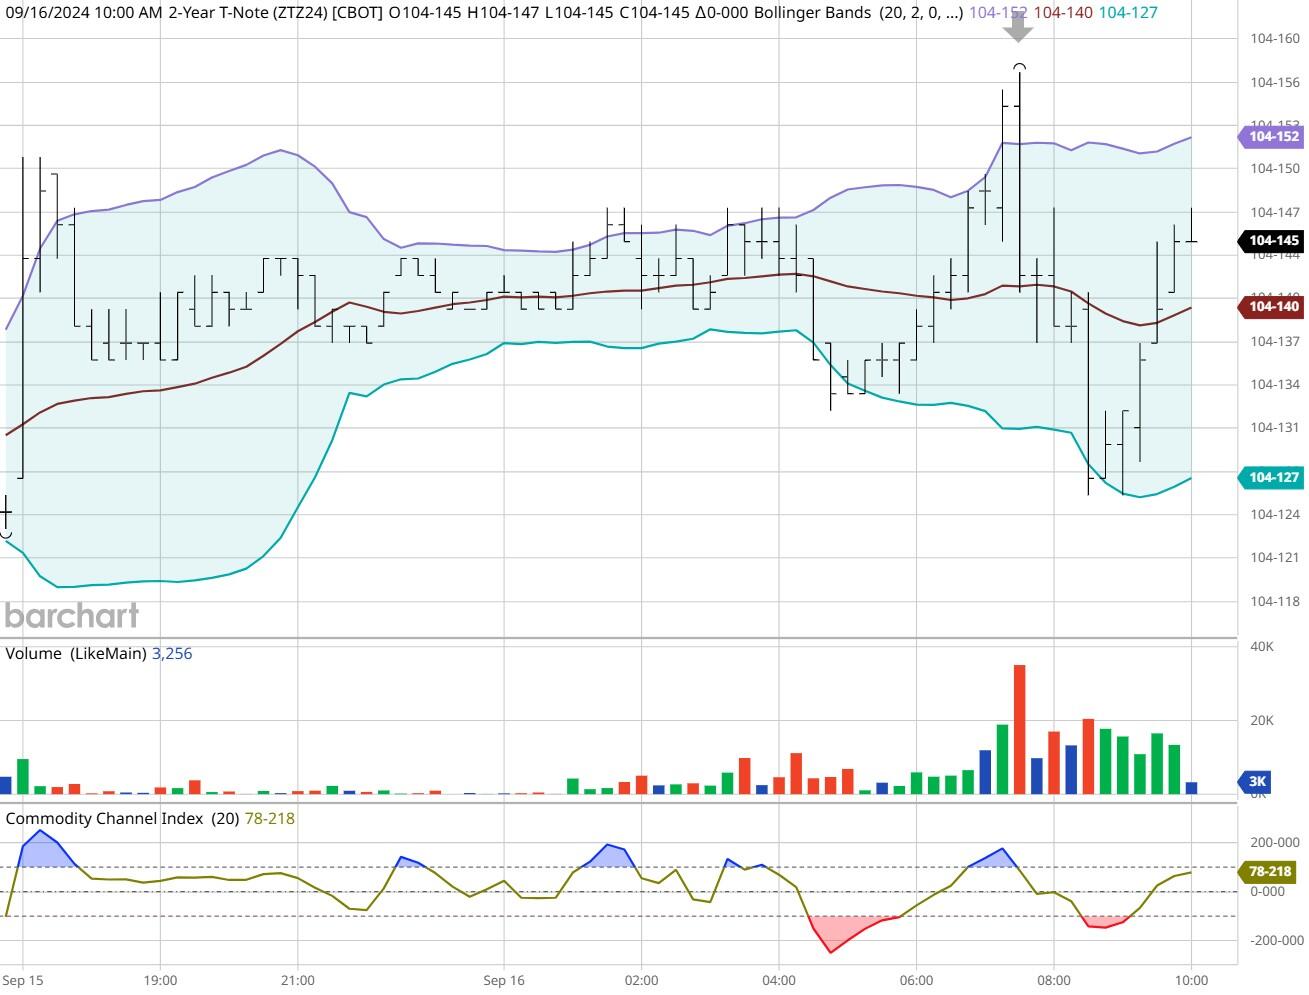
ZT -Dec 2024 - 09/16/24
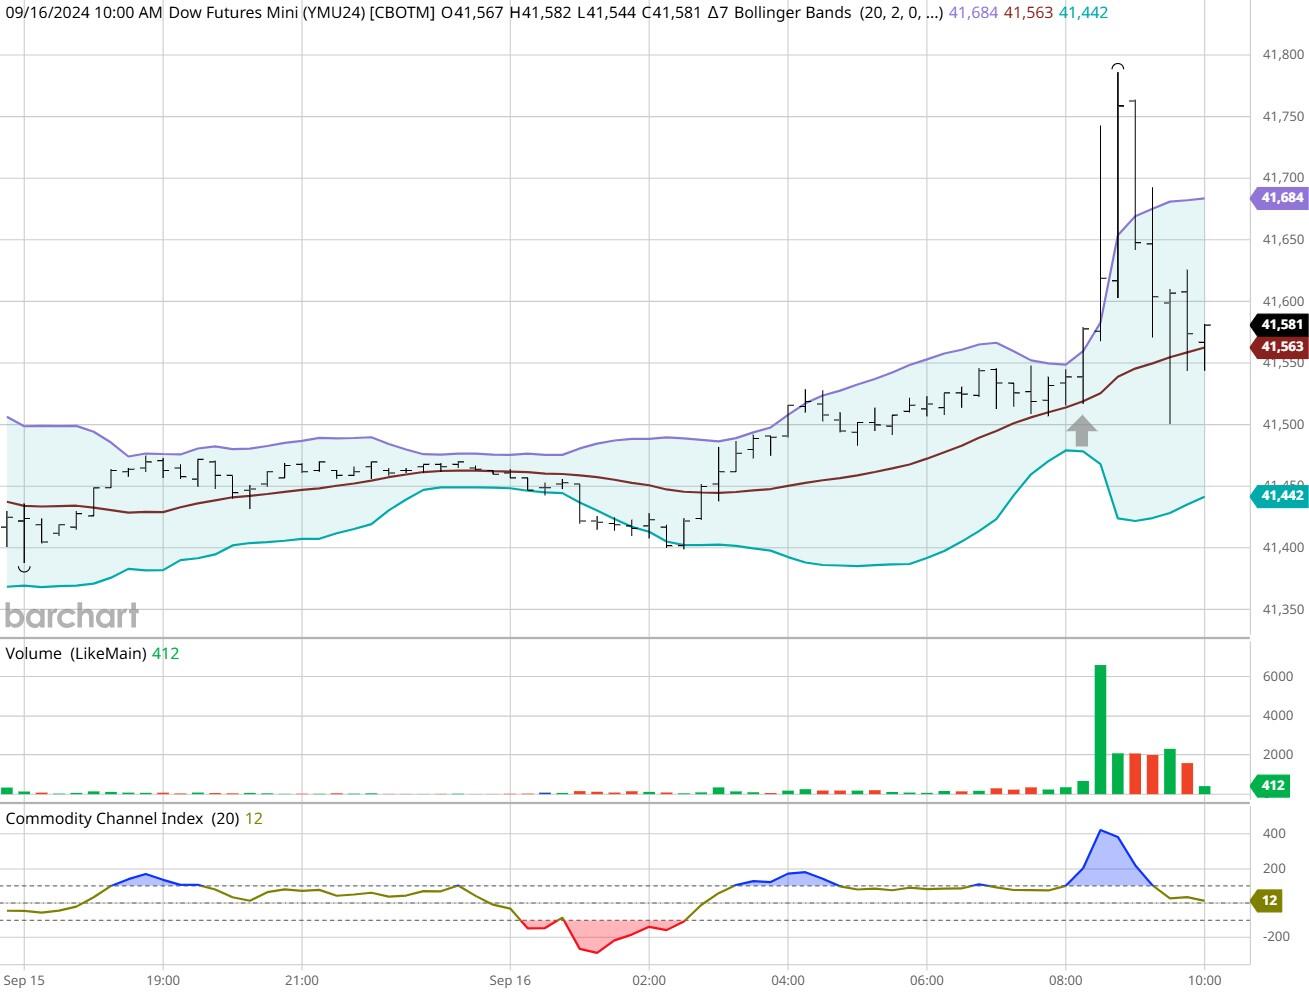
Dow - Sept 2024- 09/16/24
Bias
Yesterday we gave the markets a Neutral or Mixed as we didn't see much in the way of Market Correlation Monday morning. The markets didn't disappoint as the Dow gained 228 points, the S&P gained 7 but the Nasdaq dropped 92. All in all, a Neutral or Mixed market. Today we aren't dealing with a correlated market and our bias is to the Upside.
Could this change? Of Course. Remember anything can happen in a volatile market.
Commentary
Yesterday we didn't have much in the way of major economic news to report. We only had Empire State Manufacturing Index which BTW is a major market mover. The index did show a major gain, but the markets traded Mixed. Today is a different situation as we have seven major economic news to report and tomorrow, we have FOMC Day with the long-awaited anticipation that the Federal Reserve will finally lower interest rates. Will they do so? As in all things only time will tell.
Author

Nick Mastrandrea
Market Tea Leaves


