FOMC day

USD: Sept '25 is Down at 98.305.
Energies: Aug '25 Crude is Up at 73.34.
Financials: The Sep '25 30 Year T-Bond is Higher by 7 ticks and trading at 113.28.
Indices: The Jun '25 S&P 500 emini ES contract is 4 ticks Lower and trading at 6037.50.
Gold: The Aug'25 Gold contract is trading Down at 3399.10.
Initial conclusion
This is not a correlated market. The USD is Down and Crude is Up which is normal, but the 30 Year T-Bond is trading Higher. The Financials should always correlate with the US dollar such that if the dollar is Higher, then the bonds should follow and vice-versa. The S&P is Lower and Crude is trading Higher which is correlated. Gold is trading Lower which is not correlated with the US dollar trading Down. I tend to believe that Gold has an inverse relationship with the US Dollar as when the US Dollar is down, Gold tends to rise in value and vice-versa. Think of it as a seesaw, when one is up the other should be down. I point this out to you to make you aware that when we don't have a correlated market, it means something is wrong. As traders you need to be aware of this and proceed with your eyes wide open. Asia traded mainly Mixed. All of Europe is trading Lower.
Possible challenges to traders
- Unemployment Claims is out at 8:30 AM EST. This is Major.
- Building Permits is out at 8:30 AM EST. This is Major.
- Housing Starts is out at 8:30 AM EST. This is Major.
- Crude Oil Inventory is out at 10:30 AM EST. This is Major.
- Natural Gas Storage is out at 12 Noon. This is Major.
- Federal Funds Rate is out at 2 PM EST. This is Major.
- FOMC Economic Projections is out at 2 PM EST. This is Major.
- FOMC Statement is out at 2 PM EST. This is Major.
- FOMC Press Conference starts at 2:30 PM EST. This is Major.
Traders, please note that we've changed the Bond instrument from the 10 Year (ZN) to the 2 Year (ZT). They work exactly the same.
We've elected to switch gears a bit and show correlation between the 2-year Treasury notes (ZT) and the S&P futures contract. The YM contract is the Dow Jones Industrial Average, and the purpose is to show reverse correlation between the two instruments. Remember it's likened to a seesaw, when up goes up the other should go down and vice versa.
Yesterday the ZT dived Lower at around 8:30 AM EST with no news pending. The Dow climbed Higher at the same time. Look at the charts below and you'll see a pattern for both assets. The Dow climbed Higher at 8:30 AM EST and the ZT dived Lower at around the same time. These charts represent the newest version of Bar Charts, and I've changed the timeframe to a 15-minute chart to display better. This represented a Short opportunity on the 2-year note, as a trader you could have netted about 20 plus ticks per contract on this trade. Each tick is worth $6.25. Please note: the front month for ZT is now Sep '25 and the Dow is still Jun '25. I've changed the format to filled Candlesticks (not hollow) such that it may be more apparent and visible.
Charts courtesy of barcharts
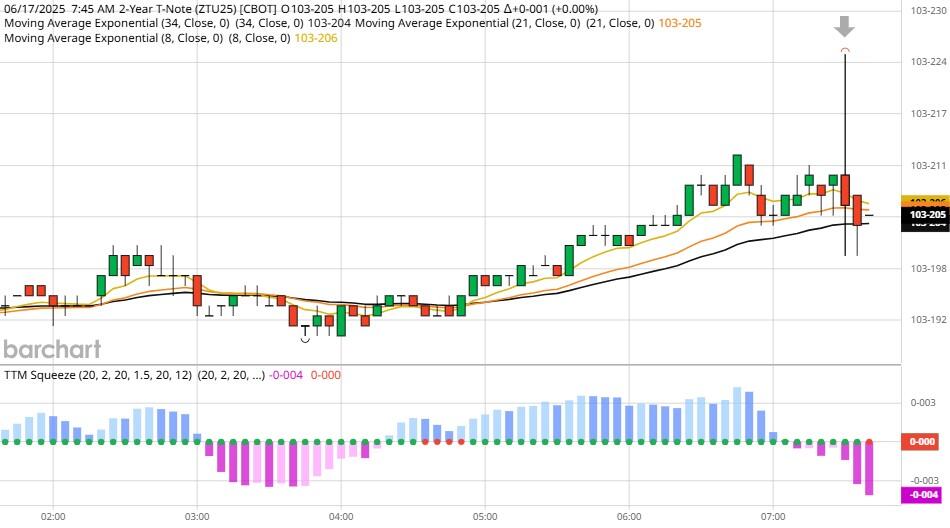
ZT -Sep 25 - 6/17/25
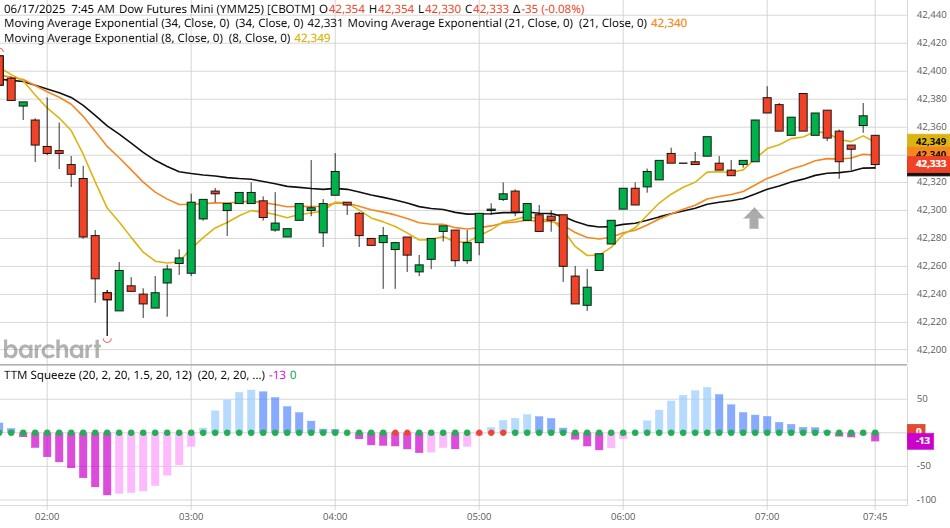
Dow - Jun 2025- 6/17/25
Bias
Yesterday we gave the markets a Neutral bias as we didn't see much in the way of correlation Tuesday morning. At first the markets leapt up and then they dropped, never to return to positive territory. Given that today is FOMC Day our bias is Neutral as the markets have never shown any sense of normalcy on this day. Tomorrow the markets will be closed for Juneteenth.
Could this change? Of Course. Remember anything can happen in a volatile market.
Commentary
Another FOMC Day and the question remains; will the Fed Lower rates? I wish the Fed would as we could all use a break on interest rates, but I think not. The Federal Reserve is still concerned about the impact the Trump tariffs will pose, and those tariffs haven't into effect yet.
Author

Nick Mastrandrea
Market Tea Leaves


