FOMC day

USD: Mar '25 is Up at 103.300.
Energies: Apr '25 Crude is Down at 66.68.
Financials: The Jun '25 30 Year T-Bond is Lower by 5 ticks and trading at 117.03.
Indices: The Mar '25 S&P 500 emini ES contract is 51 ticks Higher and trading at 5686.00.
Gold: The Apr'25 Gold contract is trading Up at 3046.20.
Initial conclusion
This is not a correlated market. The USD is Up and Crude is Down which is normal, and the 30 Year T-Bond is trading Lower. The Financials should always correlate with the US dollar such that if the dollar is Higher, then the bonds should follow and vice-versa. The S&P is Higher and Crude is trading Lower which is correlated. Gold is trading Higher which is not correlated with the US dollar trading Up. I tend to believe that Gold has an inverse relationship with the US Dollar as when the US Dollar is down, Gold tends to rise in value and vice-versa. Think of it as a seesaw, when one is up the other should be down. I point this out to you to make you aware that when we don't have a correlated market, it means something is wrong. As traders you need to be aware of this and proceed with your eyes wide open. All of Asia traded Higher except the Shanghai exchange. All of Europe is trading Higher except the German Dax.
Possible challenges to traders
-
Crude Oil Inventories is out at 10:30 AM EST. This is Major.
-
Federal Funds Rate is out at 2 PM EST. This is Major.
-
FOMC Economic Projections is out at 2 PM EST. This is Major.
-
FOMC Statement is out at 2 PM EST. This is Major.
-
FOMC Press Conference Starts 2:30 PM EST. This is Major.
-
TIC Long Term Purchases is out at 4 PM EST. This is not Major.
Traders, please note that we've changed the Bond instrument from the 10 year (ZN) to the 2 year (ZT). They work exactly the same.
We've elected to switch gears a bit and show correlation between the 2-year Treasury notes (ZT) and the S&P futures contract. The YM contract is the Dow Jones Industrial Average, and the purpose is to show reverse correlation between the two instruments. Remember it's likened to a seesaw, when up goes up the other should go down and vice versa.
Yesterday the ZT veered Higher at around 8:30 AM EST with Building Permits pending. The Dow moved Lower at the same time. Look at the charts below and you'll see a pattern for both assets. The Dow moved Lower at 8:30 AM EST and the ZT moved Higher at around the same time. These charts represent the newest version of Bar Charts, and I've changed the timeframe to a 15-minute chart to display better. This represented a Long opportunity on the 2-year note, as a trader you could have netted about 20 ticks per contract on this trade. Each tick is worth $7.625. Please note: the front month for ZT is now Jun '25 and the Dow is still Mar '25. I've changed the format to filled Candlesticks (not hollow) such that it may be more apparent and visible.
Charts courtesy of barcharts

ZT -Jun 2025 - 3/18/25
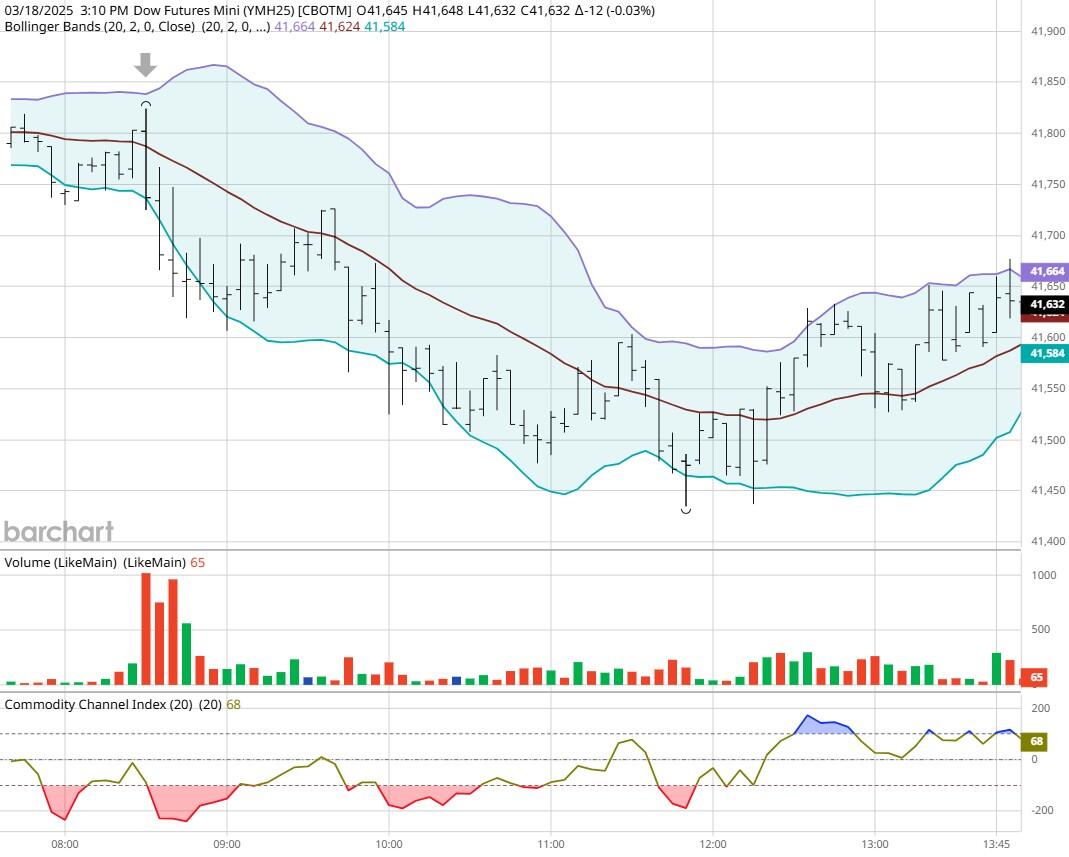
Dow - Mar 2025- 3/18/25
Bias
Yesterday we gave the markets a Neutral or Mixed bias as we didn't see much in the way of correlation Tuesday morning. The markets veered to the Downside with the Dow dropping 102 points and the other indices lost ground as well. Given that today is FOMC Day we will maintain a Neutral or Mixed bias as is our custom on this day.
Could this change? Of Course. Remember anything can happen in a volatile market.
Commentary
Yesterday we didn't see much in the way of Market Correlation hence the bias was Neutral or Mixed. The markets veered to the downside but fortunately not by very much. Today we have the FOMC meeting where the Federal Reserve will determine interest rates going forward. The question I get very often is will the fed cut? Truthfully, I don't think so and the reason is there's too much controversy going on right now with Trump and his various tariffs. I know he wants the Fed to cut but they are not doing so. Could this change? Absolutely.
Author

Nick Mastrandrea
Market Tea Leaves


