Focus turns to Earning season

USA500, Daily and Intraday
Trade jitters have calmed somewhat and investors are focusing on the start of the earnings season, with Stock market sentiment remained upbeat in Asia. UK Futures are moving higher with US Futures overnight, underpinned by a weaker Pound. The Stoxx Europe 600 index is moving higher and is also poised for a weekly gains, with techs, automakers and miners leading the way. Trumps’ thrashing of May’s Brexit plans and his praise for her adversary Johnson has been weighing on the Pound and at least so far this seems to be underpinning the UK100 which is up 0.56% in early trade, outperforming other European markets.
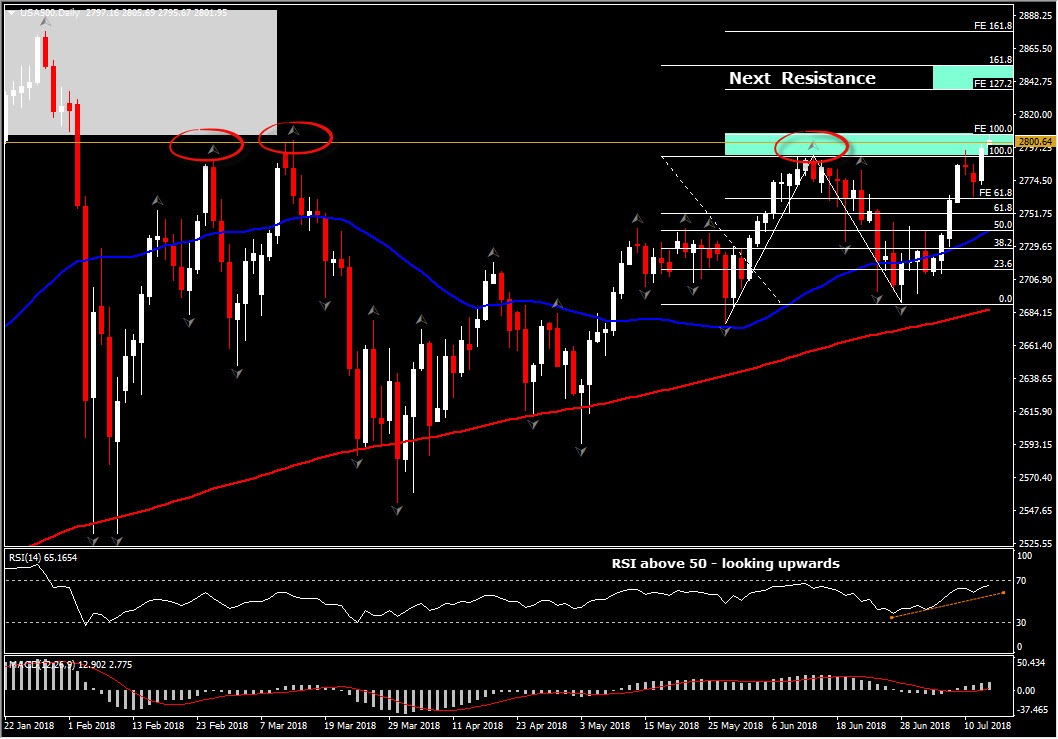
In US, Equities have retained gains with the USA500 at 2,800.65. USA500 is trading in a longterm upchannel since April with the latest correction to the downside to be occured within June. In July it is showing modest gains, which boosted USA500 since yesterday within 2,791.00- 2,807.00 area. The particular area was rejected several times the last 5 months, that made it as an extremely strong Resistance. More precisely it is consistent with 2 consecutive weekly upper fractals along with 5-month highs of price action and ti is set between June’s peak and the 1st level of Fibonacci extension. Fibonacci extension was set after the retracement swing low occurred in June 28.
Momentum indicators suggest that outlook is turning positive again, as daily RSI rebounded above 59 swing low and MACD turned positive with its lines increasing above its signal line. Stochastic however is moving within the overbought territory, suggesting that upside movement is running out of steam and therefore price could make a correction lower.
The overall picture of the USA 500 suggests that if the asset holds the strong rally and closes above 2,807.00, then bulls will likely to retest the next strong Resistance level at 2,837.00 (FE 127.2).
If however the rally fails to extend gains above 2,807.00, then this would imply that it has brought to an end. A swing lower below June’s peak at 2,790.00, could trigger the attention towards the confluence of 50-Day SMA and 50% Fib. level, at 2,740.00

Author

Having completed her five-year-long studies in the UK, Andria Pichidi has been awarded a BSc in Mathematics and Physics from the University of Bath and a MSc degree in Mathematics, while she holds a postgraduate diploma (PGdip) in


