Fed December Rate Hike – DXY Technicals – Elliott Wave Analysis
FED December Rate Hike – DXY Technicals – Elliott Wave Analysis
This week, on Wed Dec 13th 2017, Federal Funds Rate & FOMC Press Conference will be in focus as the Market is expecting a Rate Hike, from 1.25% benchmark points towards a possible 1.50%.
At this stage the Rate Hike is pretty much priced in by the Market and its Investors, therefore, a shock and an exaggerated move is not quite in the menu, unless a “surprise” would occur, contrary to the expectations.
The headlines of respectable sources state that the Rake Hike would occur:
“On Track For a December Rate Hike”
“PCE inflation reading ‘just enough’ to keep Fed moving”
“Fed rate hike expected next week, three hikes expected in 2018”
Investors are not against a Rate Hike, after all it’s priced in, according to some polls, there are 90% chances for it to happen. What they want to see is whether or not the FED will firmly state during the Press Conference that they are on the right path for continuous Rate Hikes in 2018 and that the Inflation expectations or readings meet their requirements.
During the months that passed investors witnessed a stable pulse when it comes to Economic Indicators.
PCE Inflation, according to rumours, is the FED’s favourite economic indicator, but its reading ticked only the ‘’satisfying” box.
Consumer Spending however is a different story, it actually decreased overall.
Inflation readings did not impress. Jobs Sectors, Hourly Earnings & Unemployment were overall mixed.
Manufacturing and Non-Manufacturing sectors contracted.
Overall, as usual, the Economic Data and Fundamentals are mixed with a touch of optimism.
Technicals however are pointing towards a possible ‘’surprise”, not from the Rate Hike, but from a potential disappointment during the FOMC Press Conference.
I’ve been asking myself the following question this week:
“Will the USD going to get trashed this week?”
The reason behind questioning this important event is because it tends to line-up with the Wave Counts and the Dollar Index, according to my charts, is probably pointing lower, towards another Bearish Swing.
Let’s make a DXY recap:
-
Aug 7: “Dollar Index – Market Crash Road Map – Full Elliott Wave Cycle” article in which I explained the possibility for the Market to begin a Corrective Pattern, which took place.
-
Sep 6: “USD Reversal - Metals Correction - FX Majors Weaker” article in which I mentioned that DXY was ready to bounce and gain some strength. Reversal was confirmed after all.
-
Nov 8: “Dollar Index (DXY) – Bearish Minor 5 – Trend Continuation” article in which I pointed out the possibility for the USD to begin a down-trend. Down-trend unfolded, I was pleased.
Now, the second question is:
“Will I score again?”
The current Wave Count states that the Dollar Index possibly started the down-trend already and reversing in a Bullish Corrective Pattern, synchronizing with the FOMC event on Dec 13th 2017.
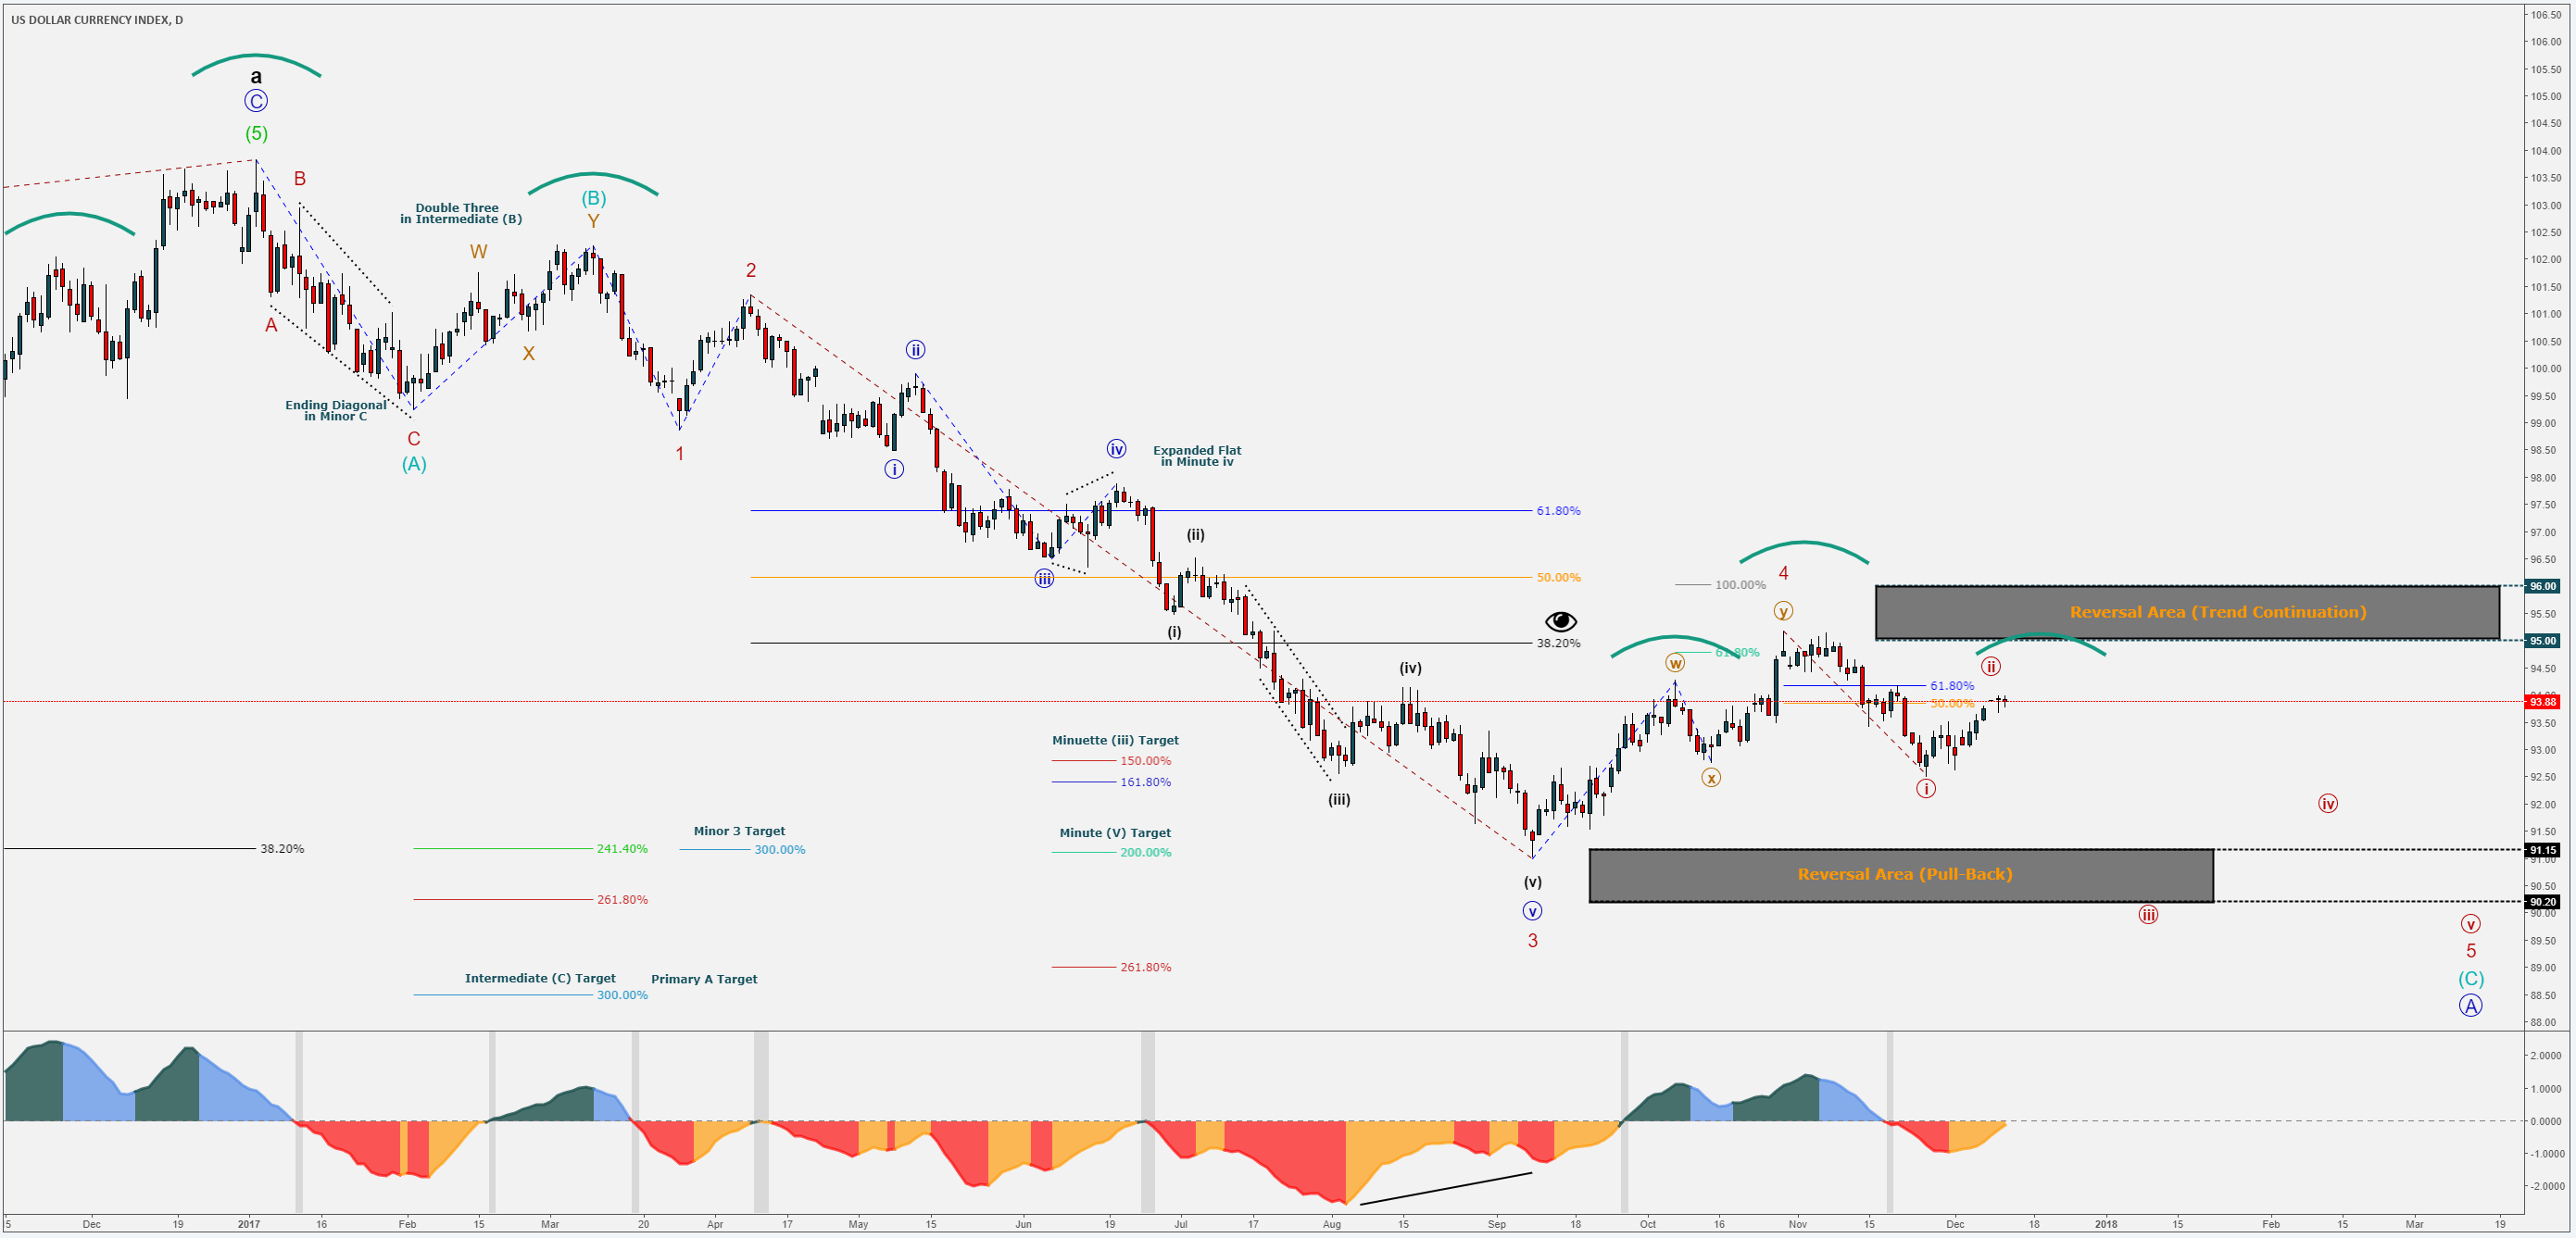
Dollar Index – Daily Chart:
Dollar Index – 2H Chart:
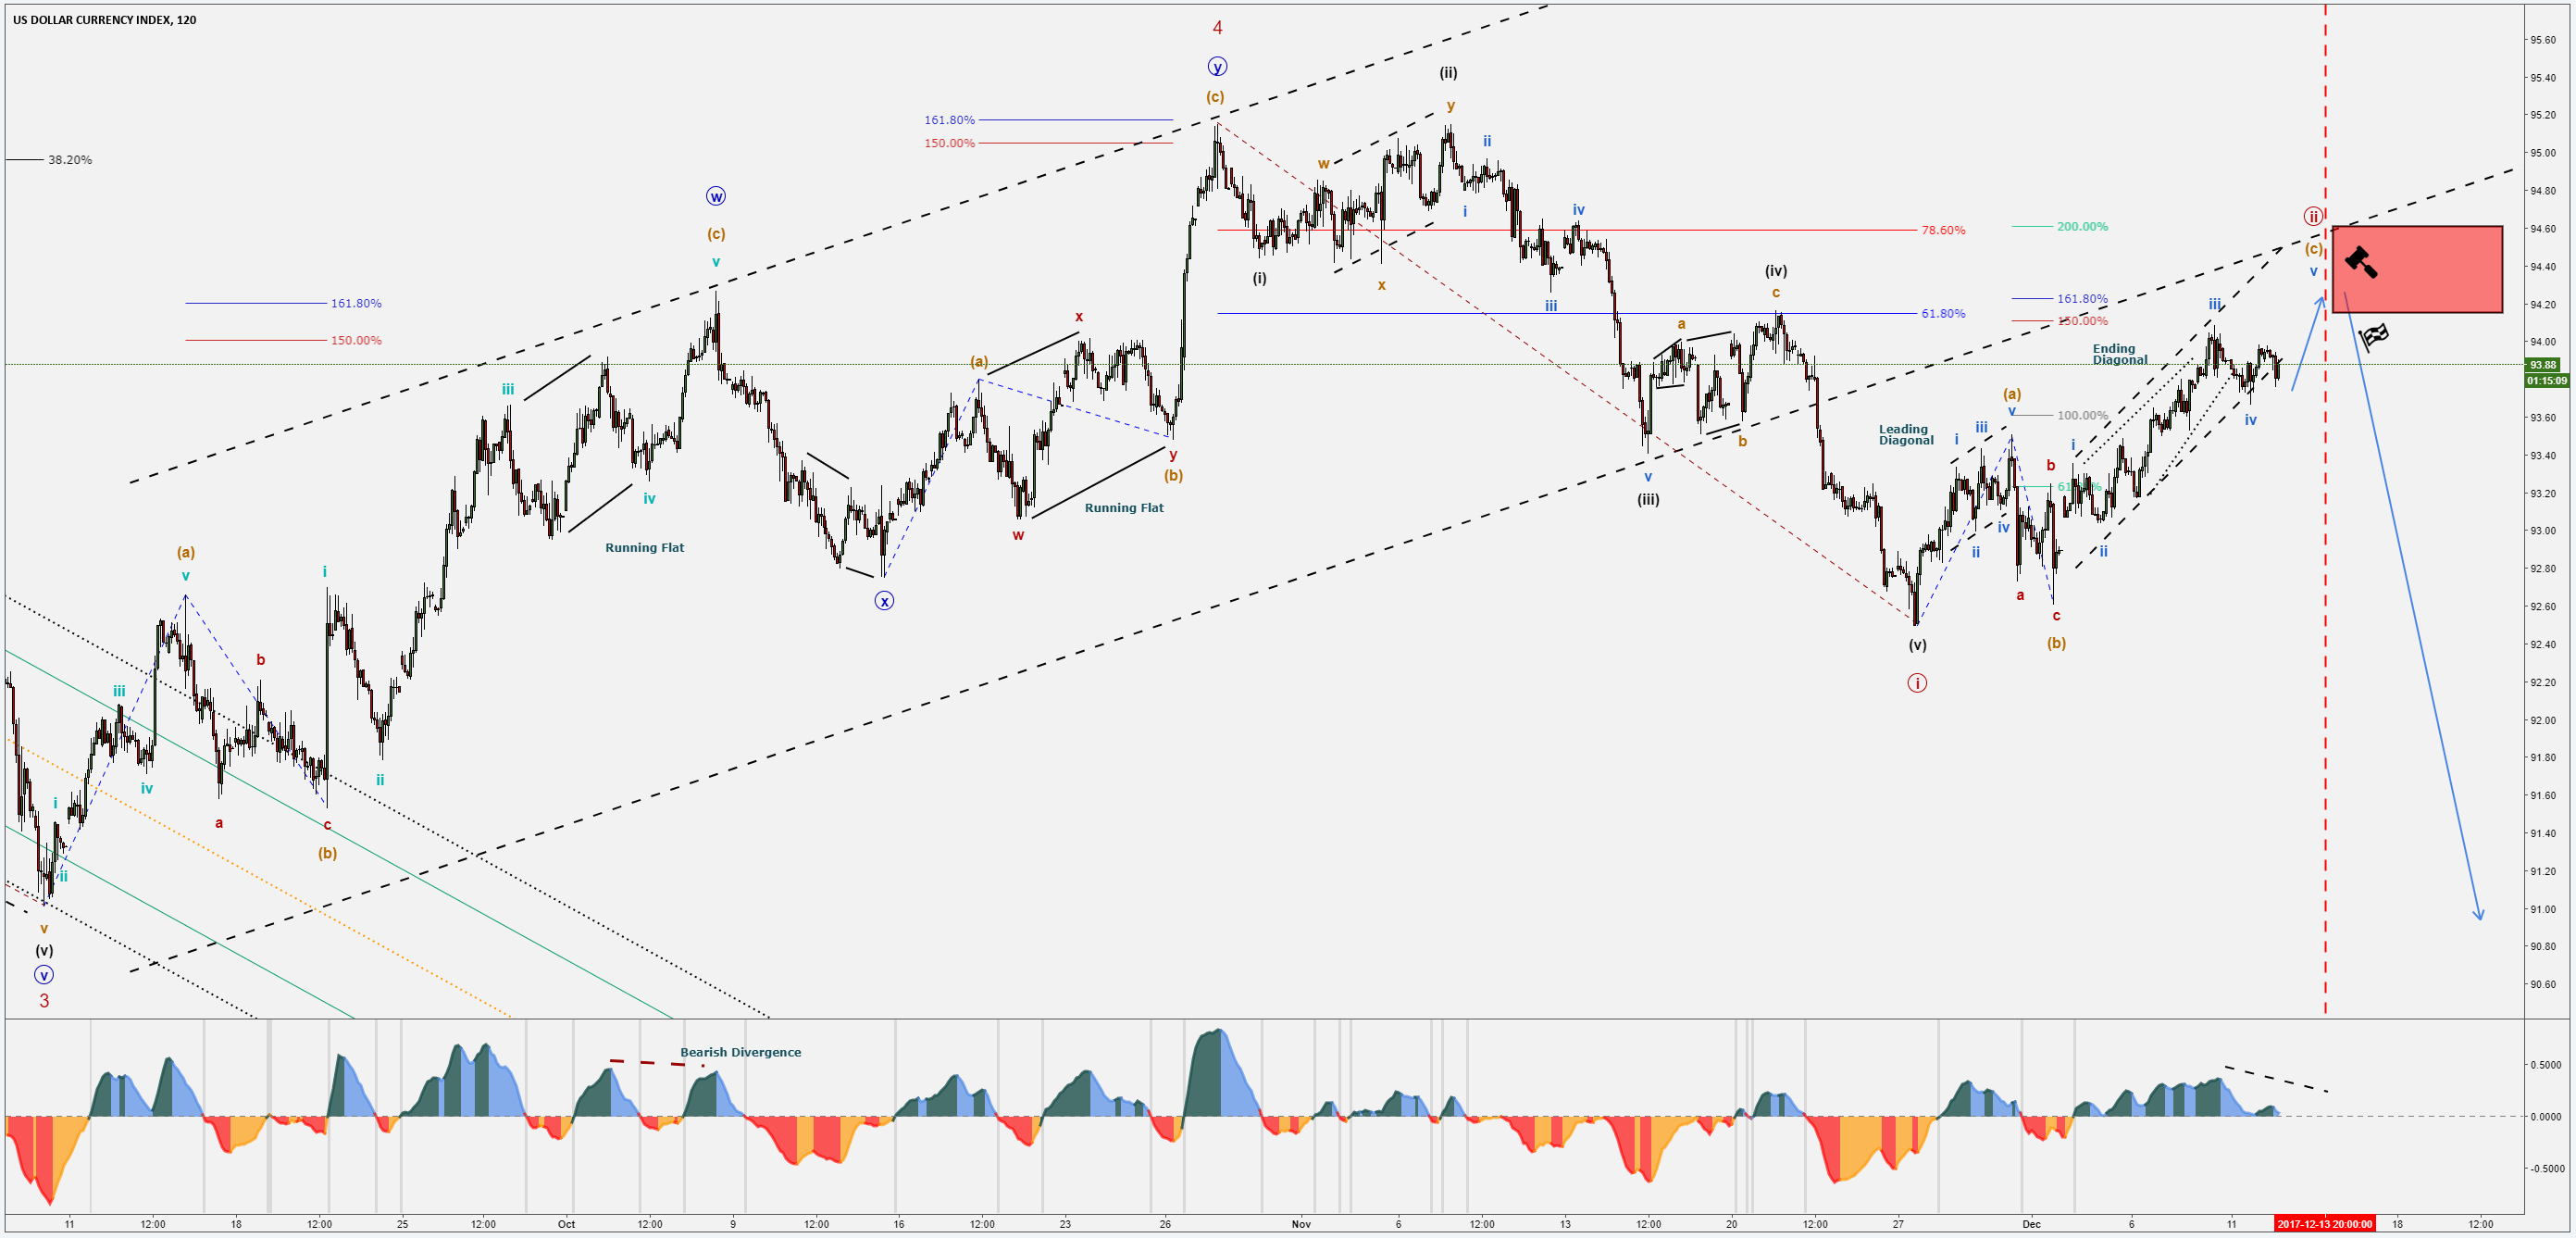
DXY - Wave Analysis:
Minor 4 (red) – Double Three Pattern:
-
Minute W (blue) unfolded as an Extended Zig-Zag, with the extension occurring in Minuette (c) (orange), under the form of an Ending Diagonal.
-
Minute X (blue) unfolded with a typical short-lived pull-back, defining the Complex Structure.
-
Minute Y (blue) unfolded in a ‘’three”, with a Running Flat pattern in Minuette (b) (orange) and a false break-out in Minuette (c) (orange.
Bearish Minute I (red):
-
Minute I (red) unfolded with a Bearish 5 Swings Sequence, with Alternation between its Corrective Structures (Complex & Simple).
-
Minuette (v) (black) shows a possible Break-Out from the former Rising Channel.
Corrective Minute II (red):
-
Minute II (red) is unfolding on the up-side but with a 3 Swings Sequence so far, typical for a possible Zig-Zag structure. Fibonacci Projections point towards the 61.8% Fibonacci Retracement of Minute (I) (red).
-
Minuette (a) (orange) unfolded as a Leading Diagonal and Minuette (b) (orange) followed with a sharp pull-back, in a Zig-Zag.
-
Minuette (c) (orange) is unfolding as a possible Ending Diagonal, within a Rising Channel, awaiting a possible Bearish Divergence.
-
Minuette (c) (orange) would be expected to finalize at or around the 161.8% Fibonacci Extensions of Minuettes (a) & (b) (orange), which is also appearing to synchronize with the retest of the lower channel trend-line.
From a technical stand-point, DXY ticks some important boxes and agrees with the possibility of the USD getting dumped.
There is also a Head & Shoulders pattern visible on the DXY Daily Chart, could Minute II (red) be the Right Shoulder? :)
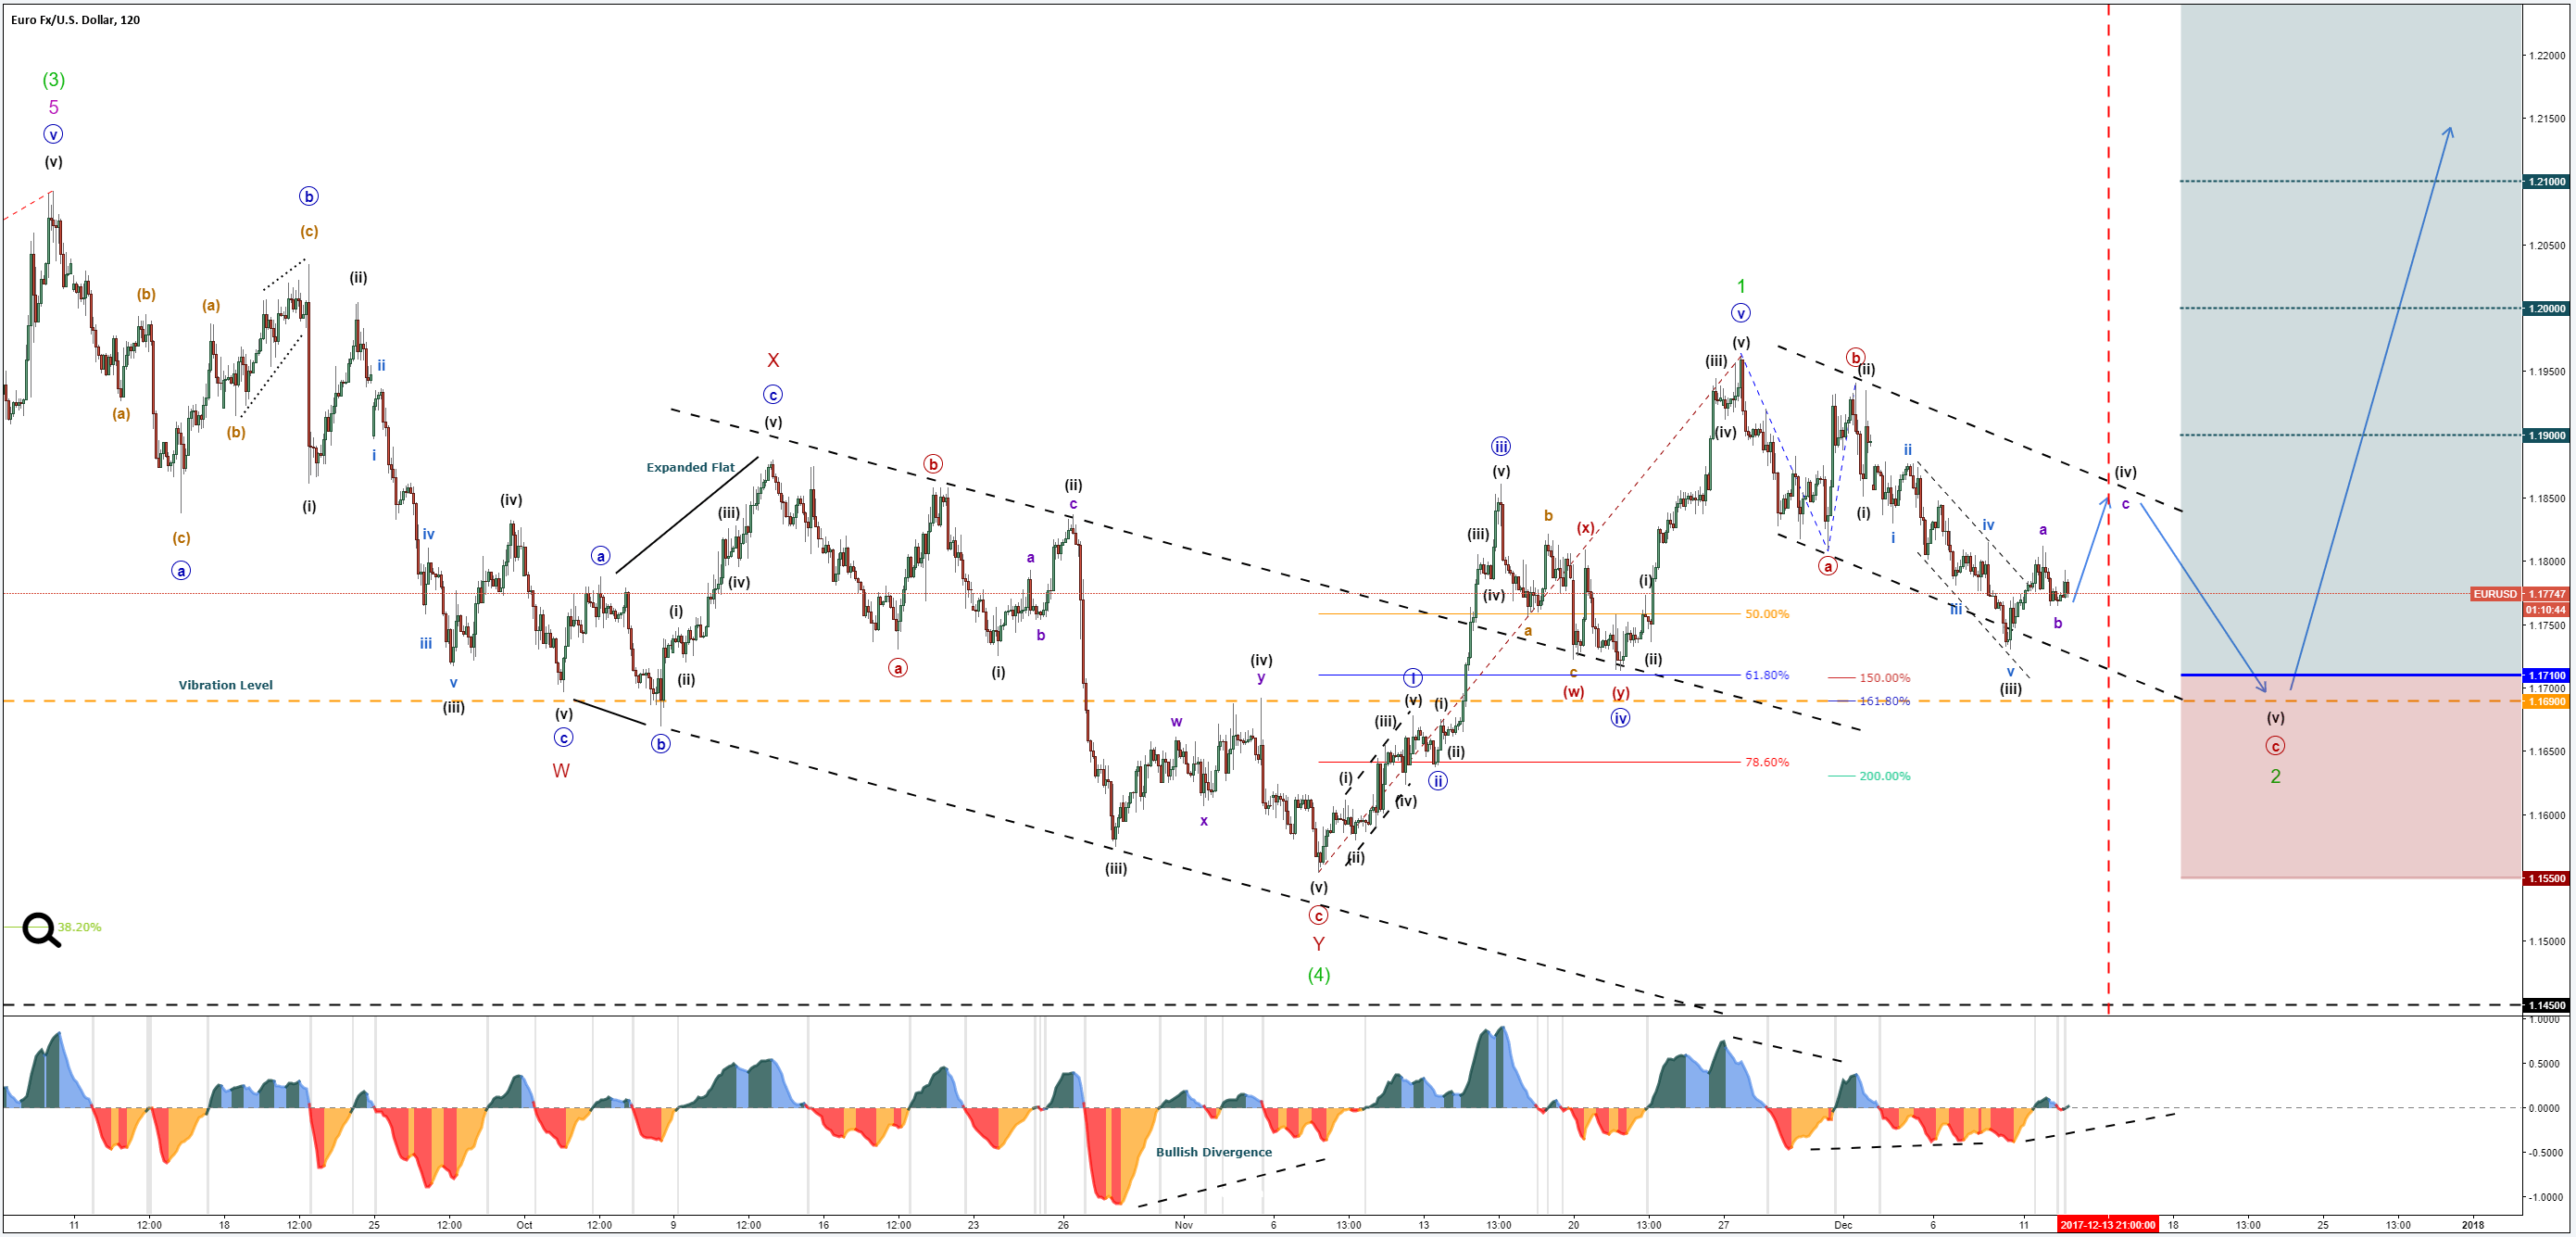
EUR/USD – 2H Chart:
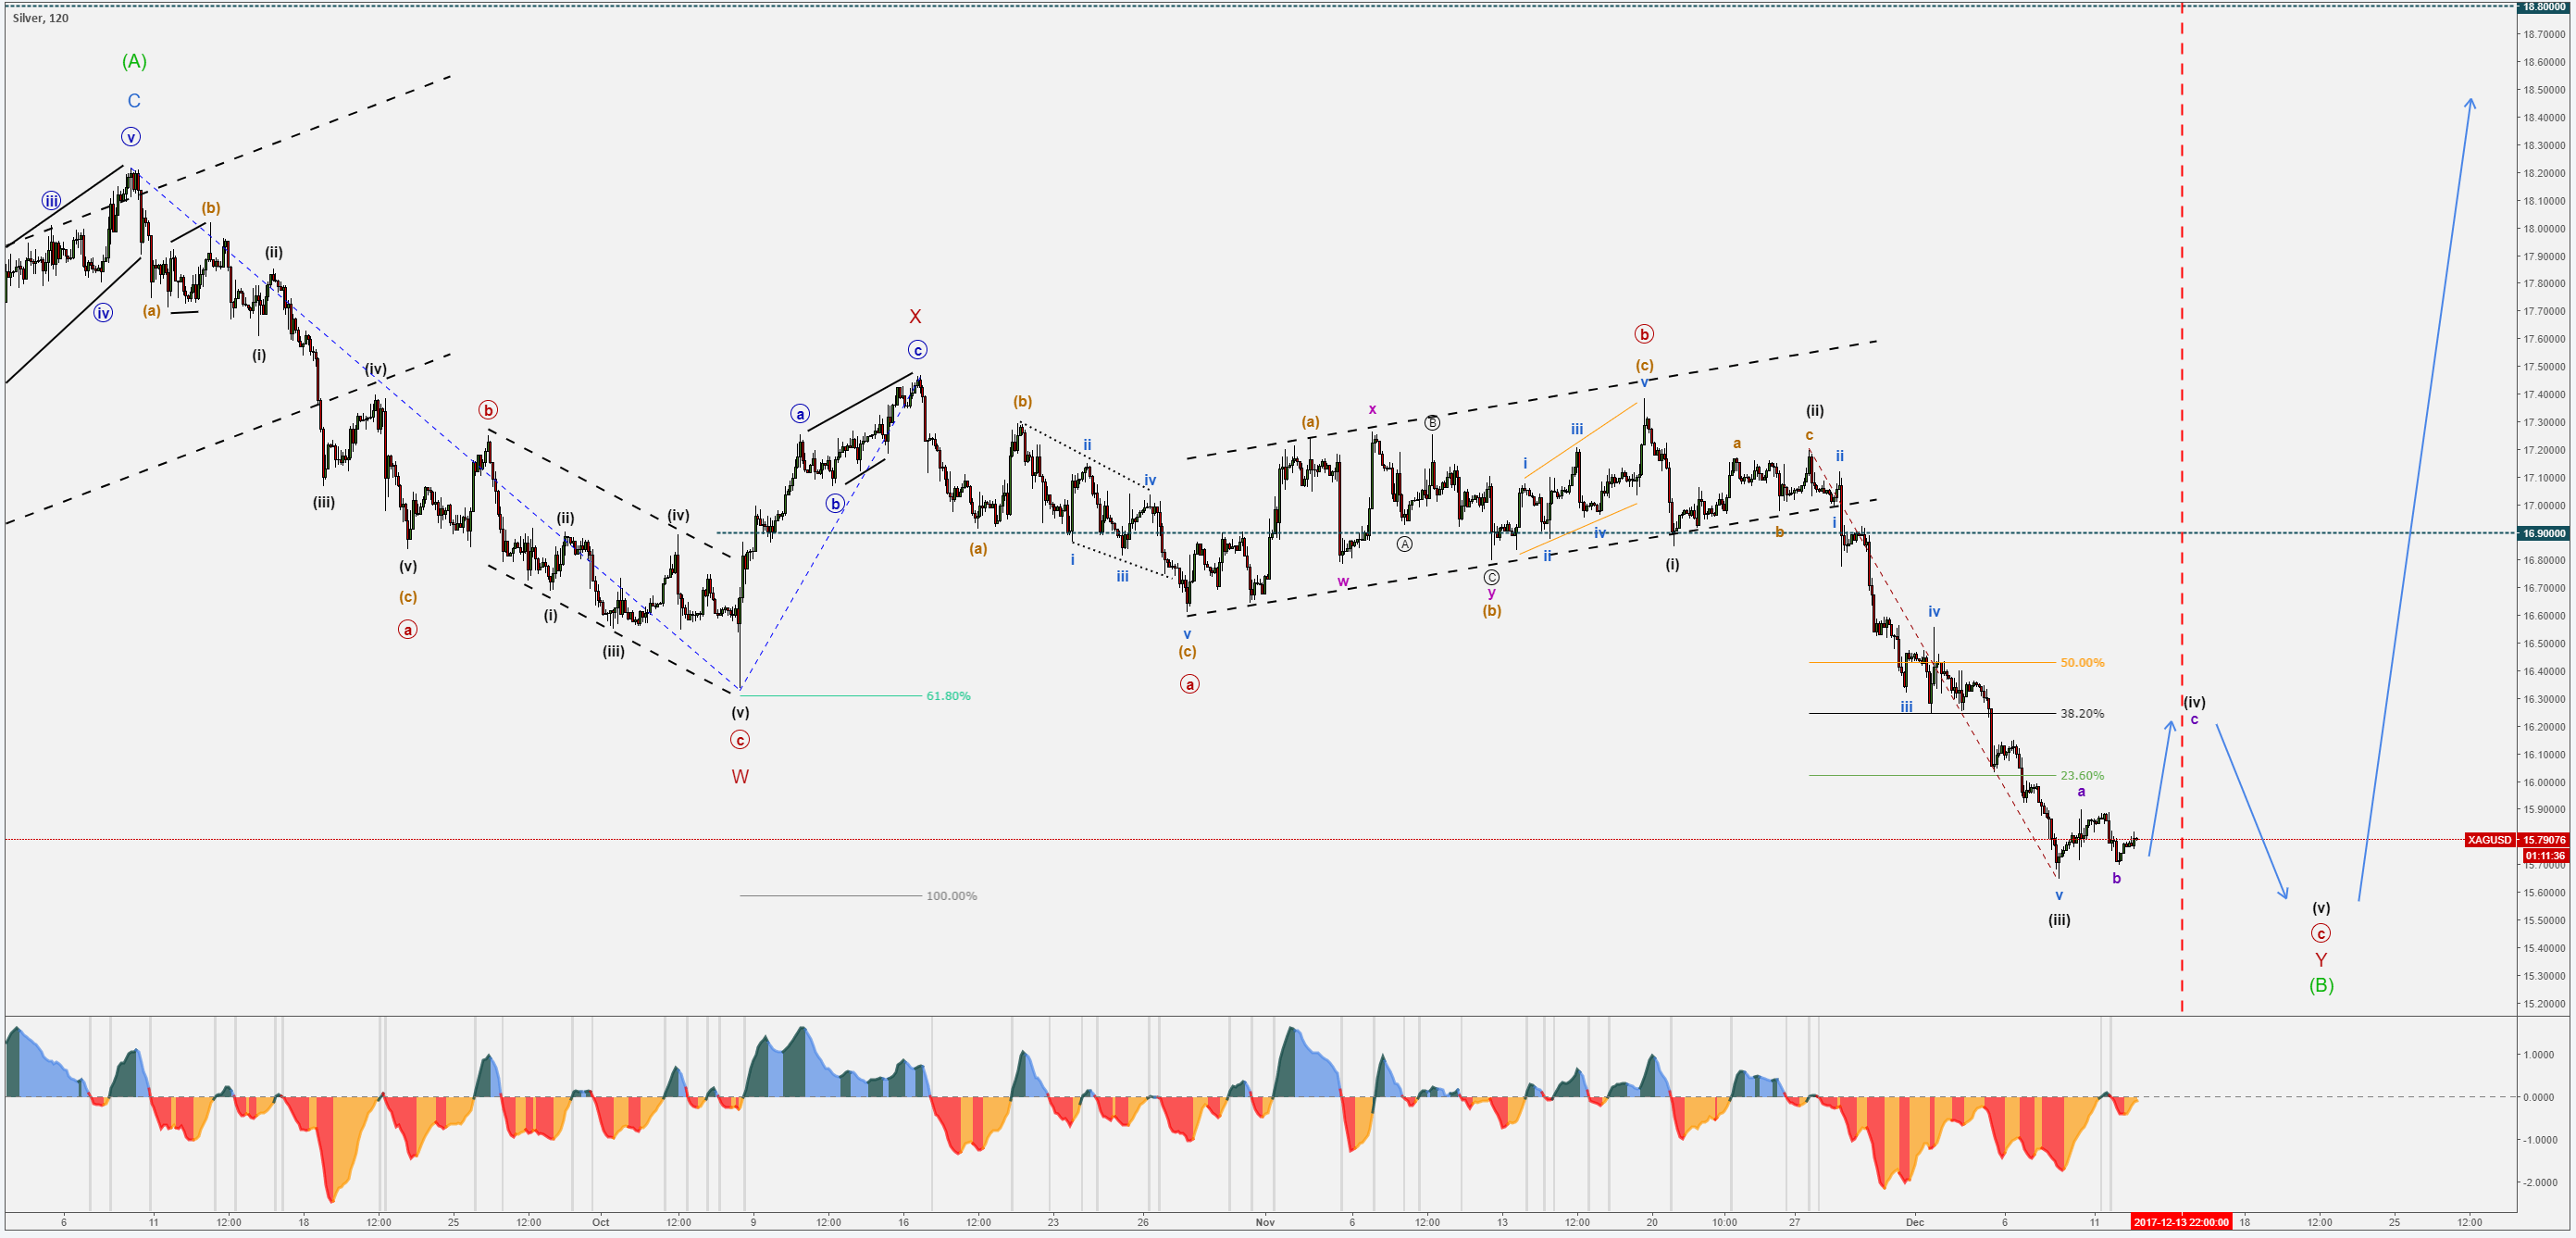
XAG/USD – 2H Chart:
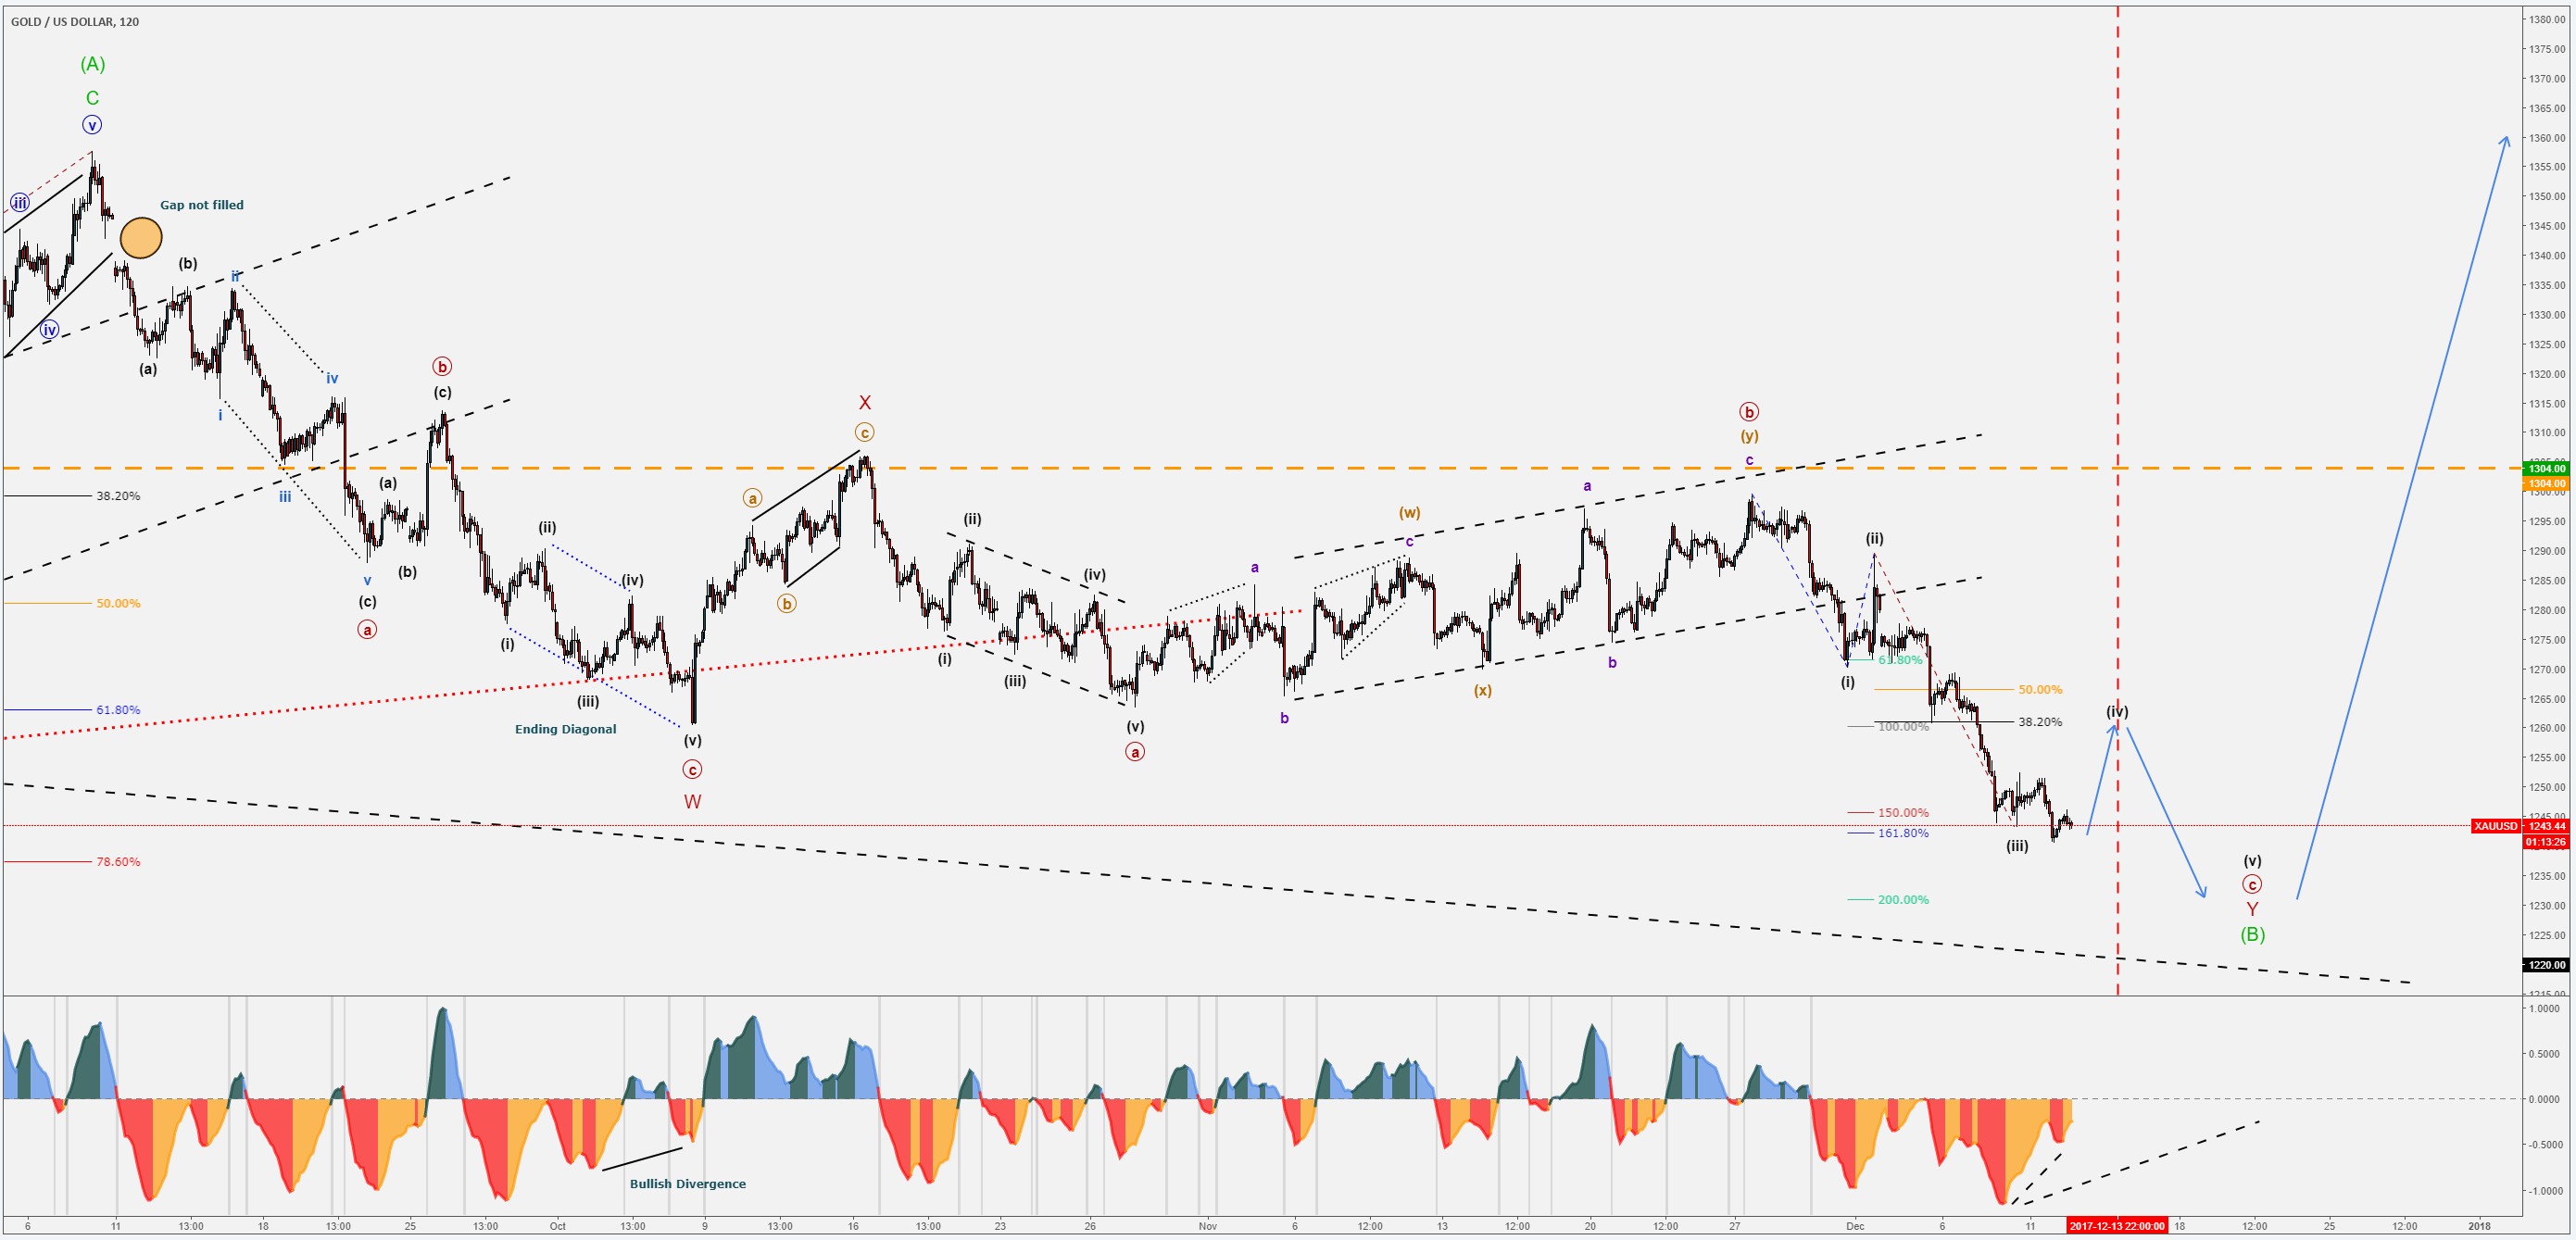
XAU/USD – 2H Chart:
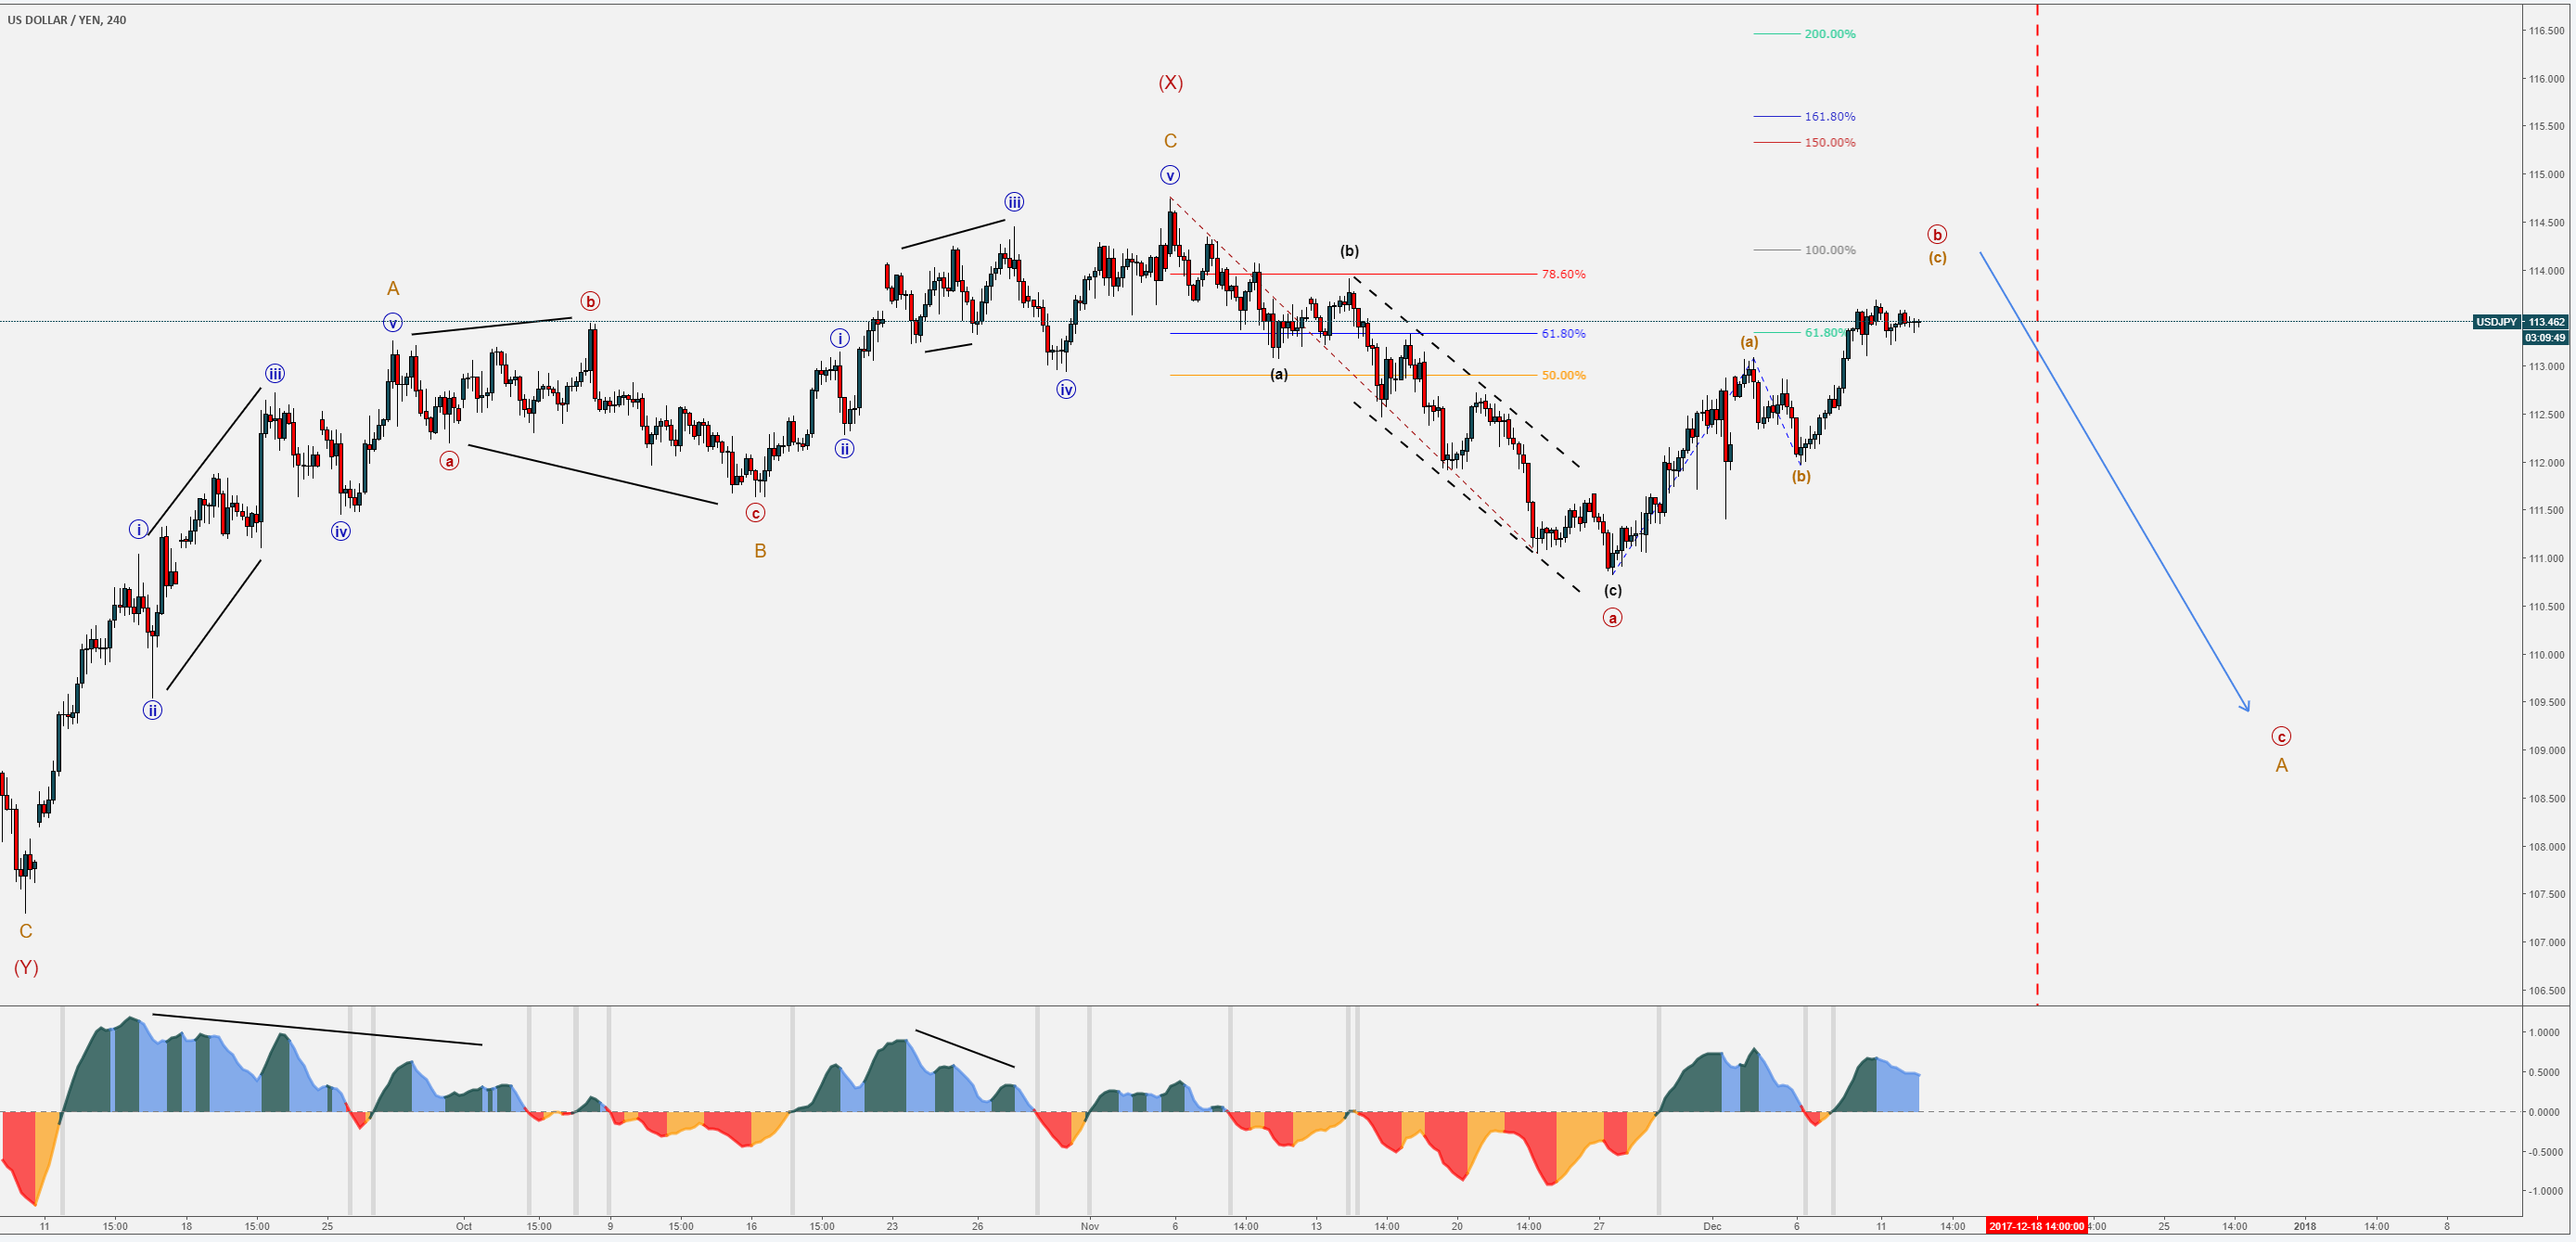
USD/JPY – 2H Chart:
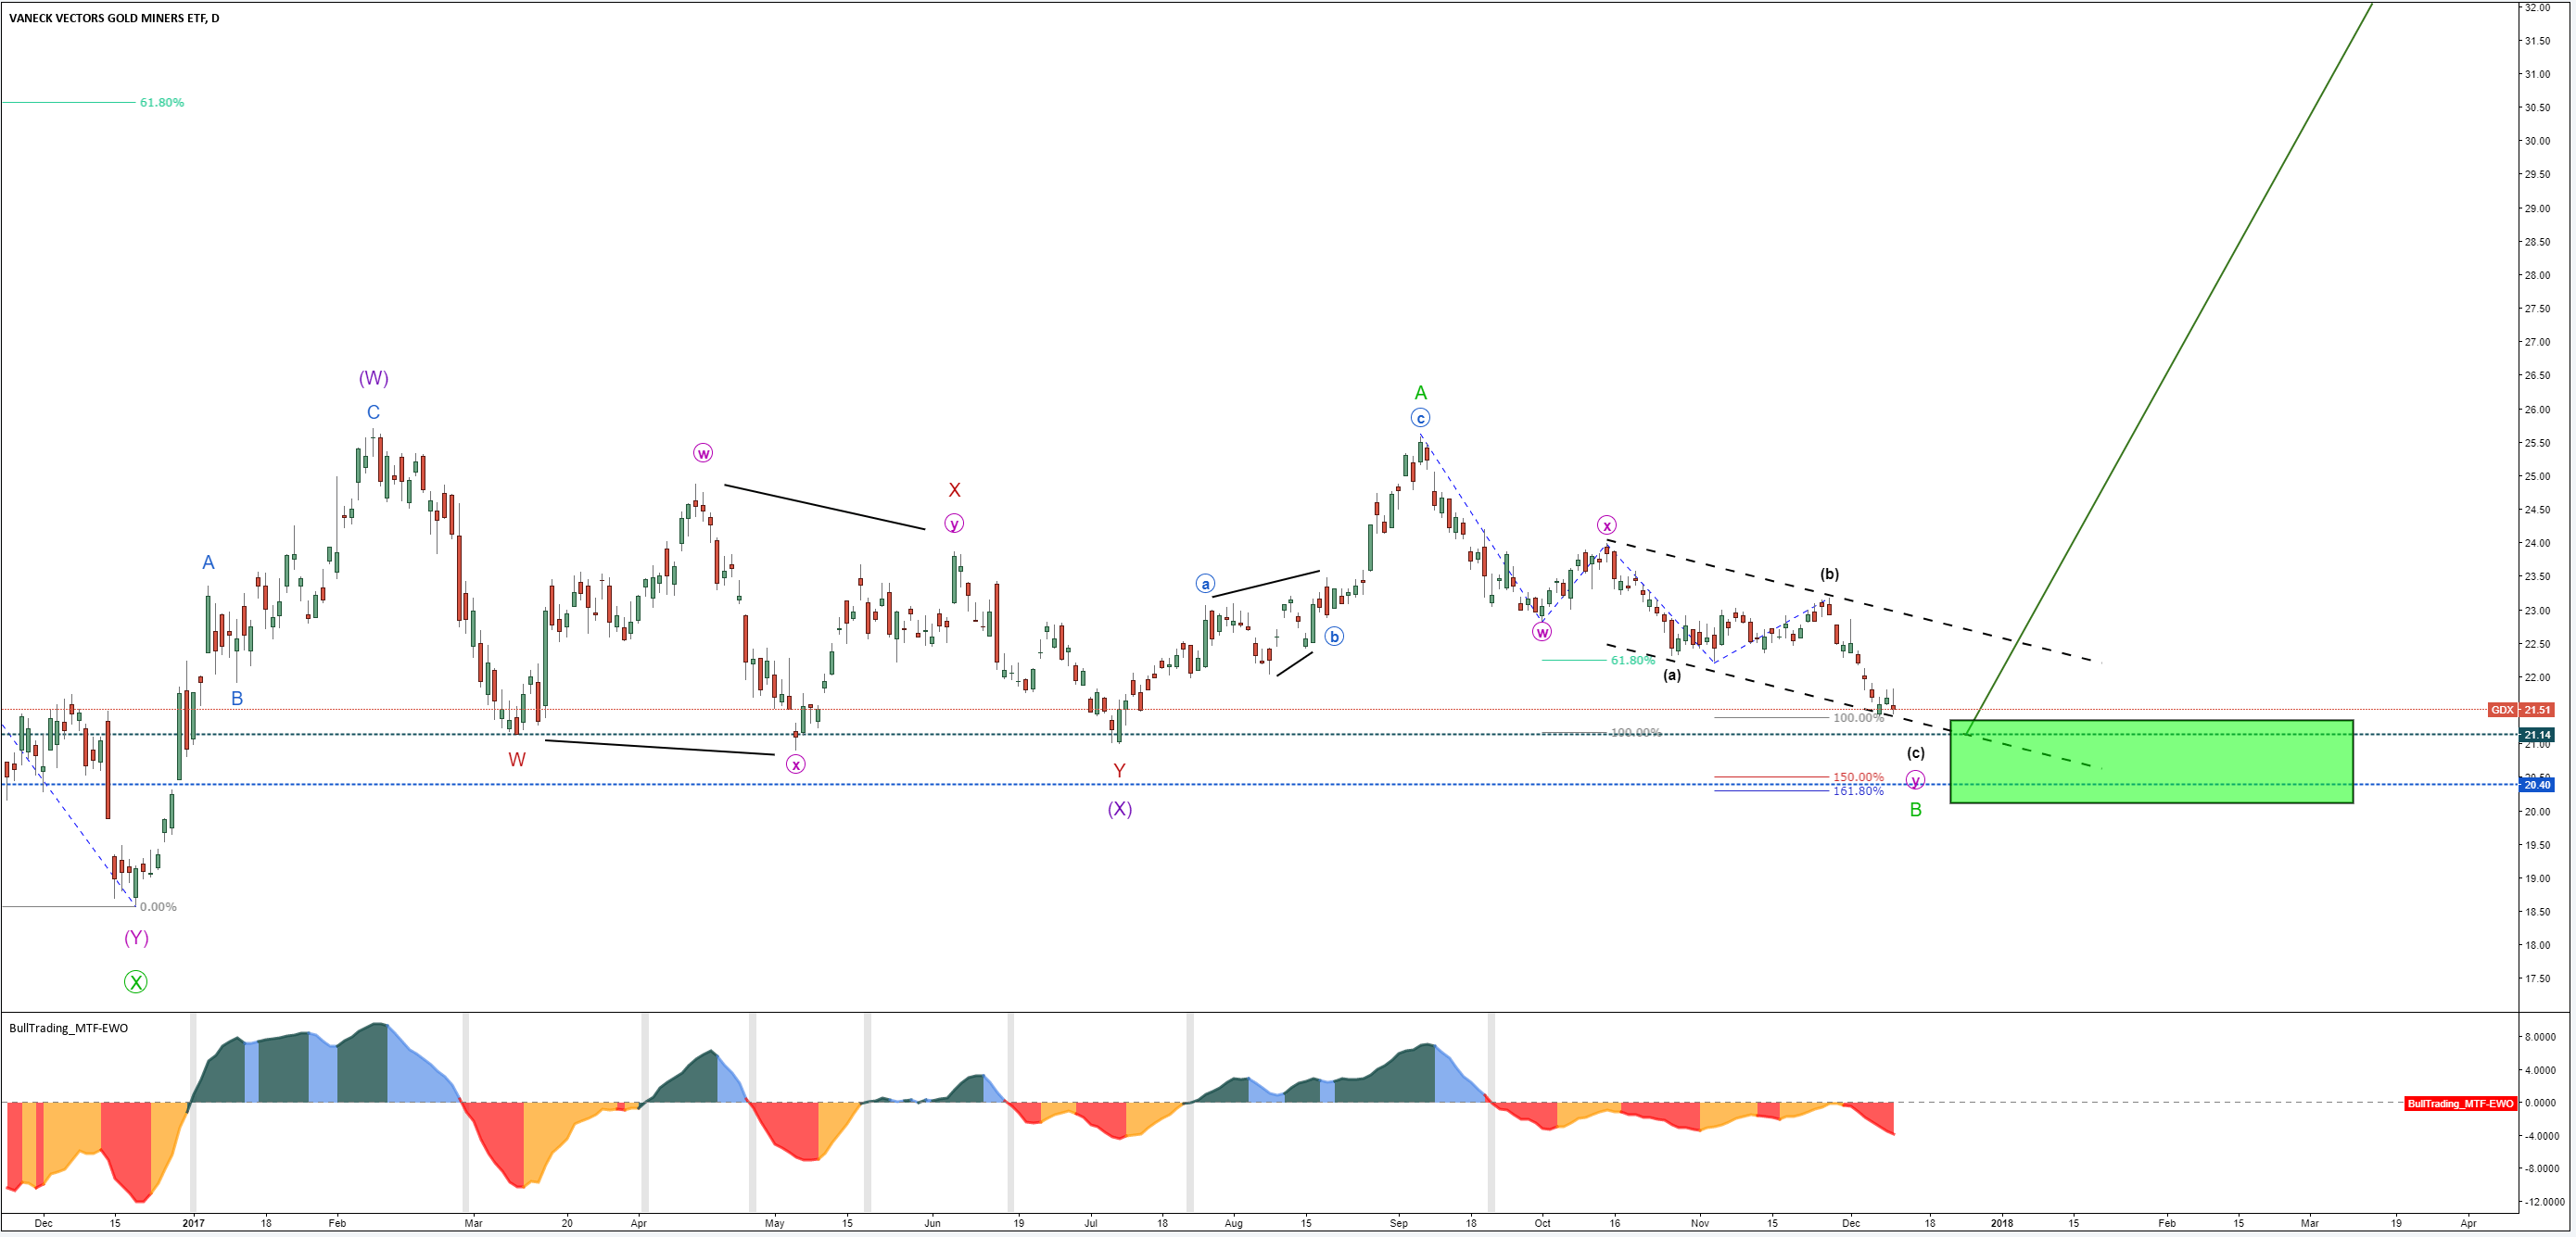
GDX (mining vectors) Daily Chart:
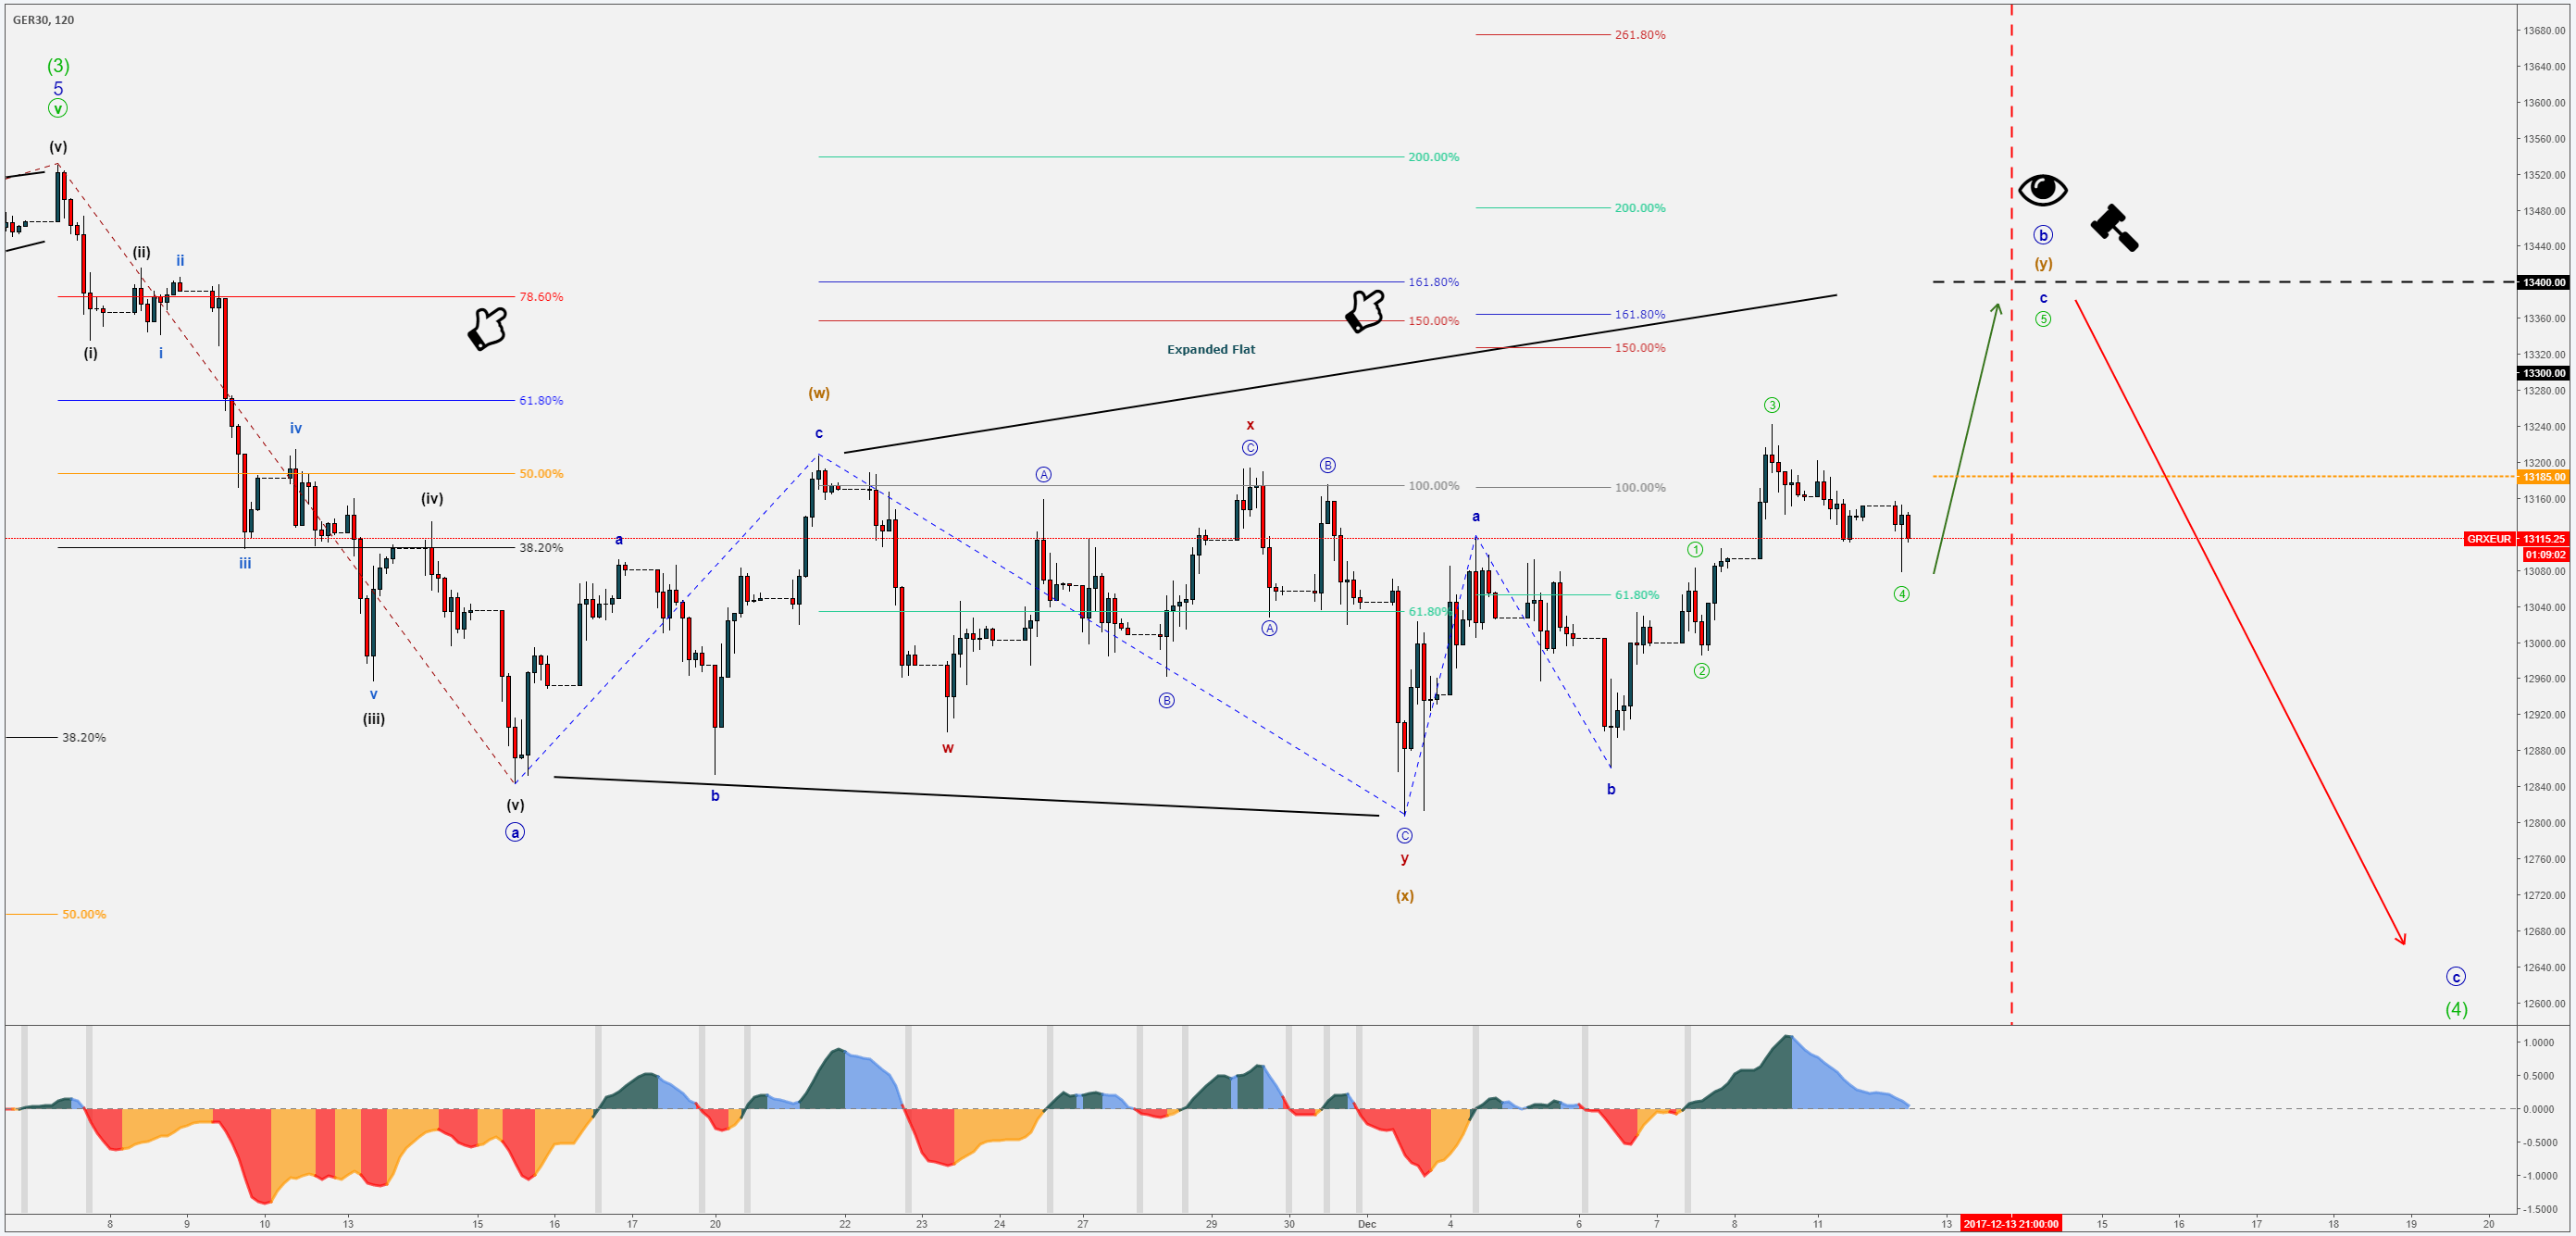
DAX30 – 2H Chart:
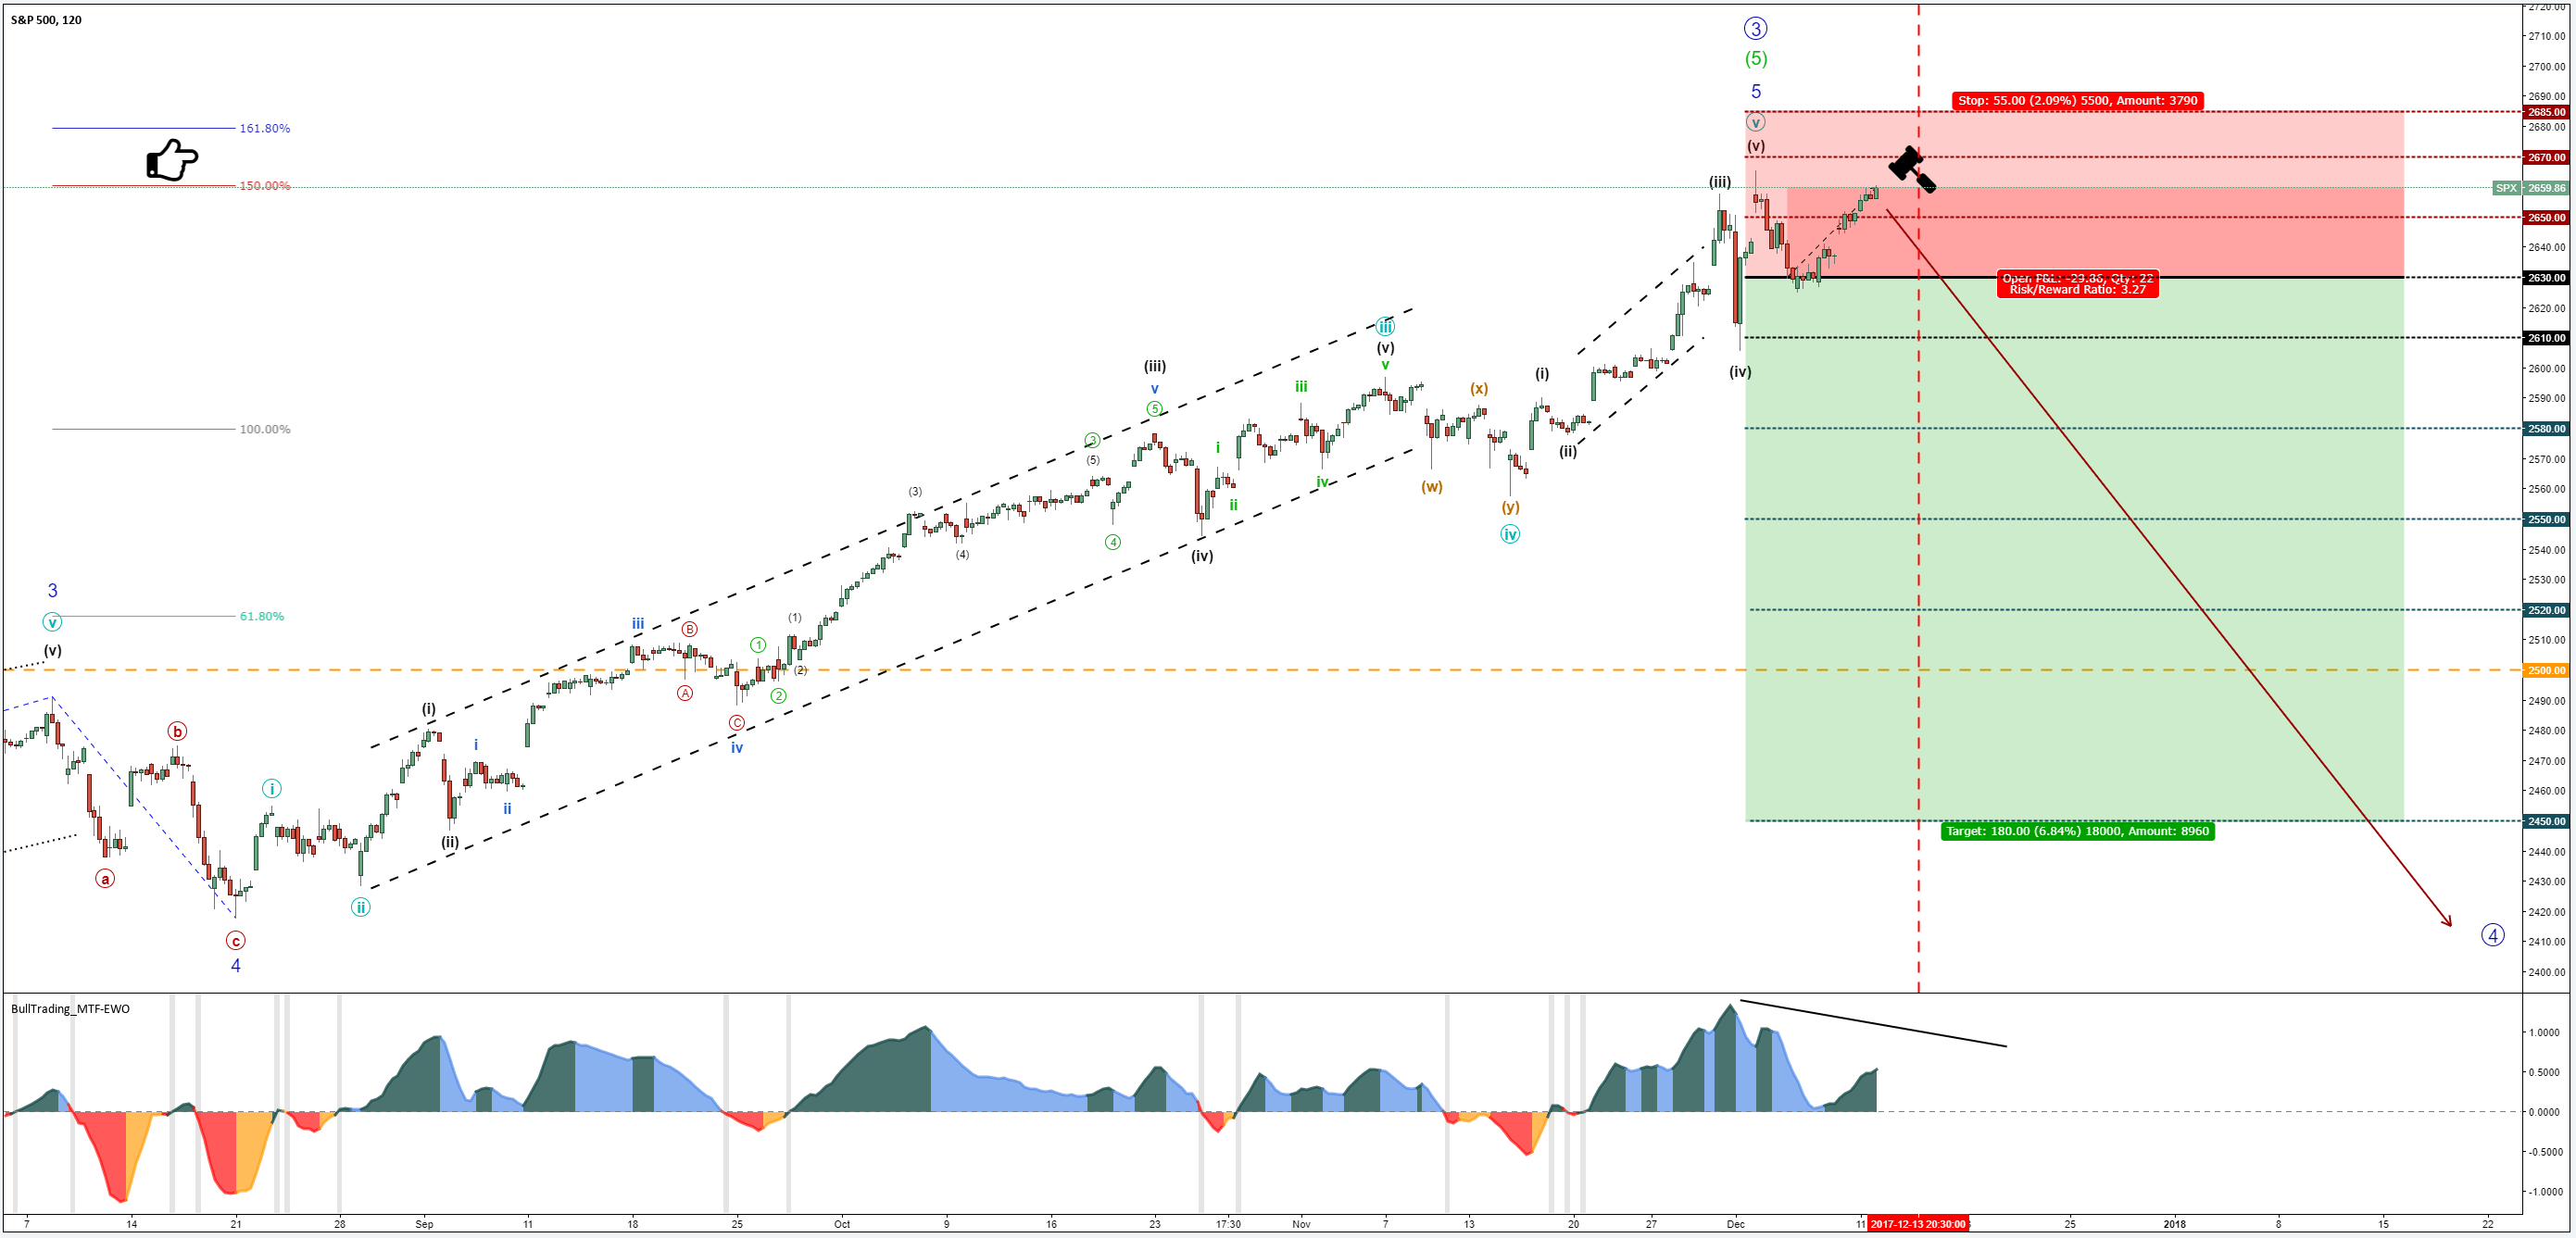
SNP500 – 2H Chart:
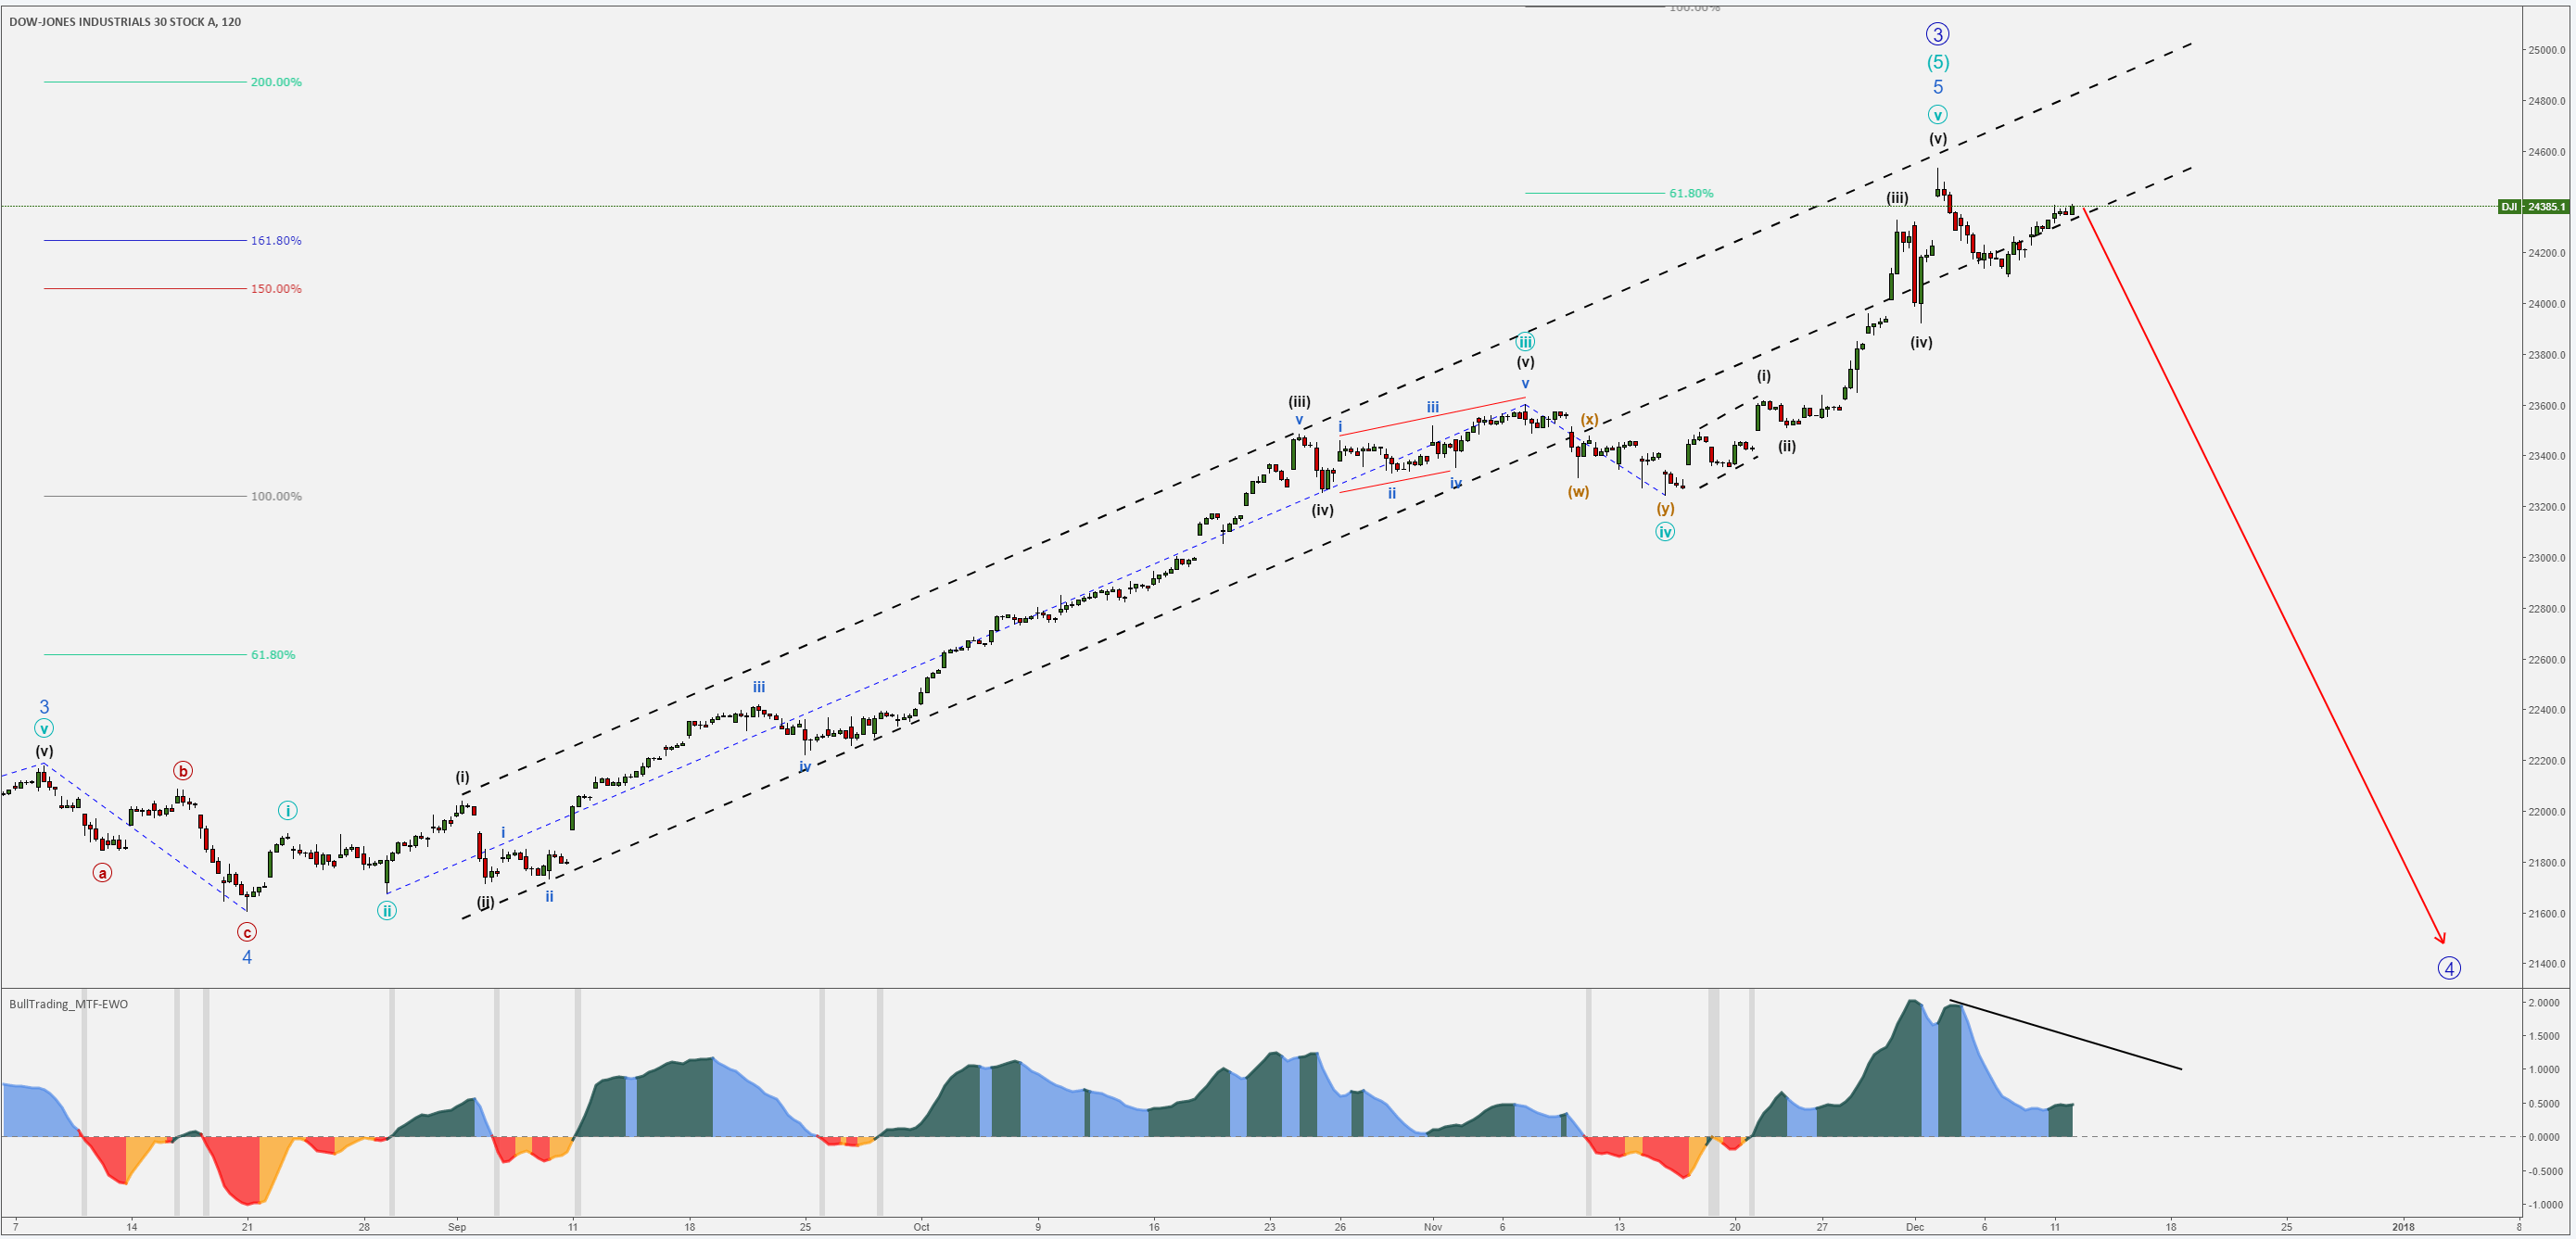
DOW30 – 2H Chart:
Author

Richard Tataru
XGlobal Markets
Richard is a market analyst and holds the role of Senior Account Manager at XGLOBAL Markets. He is passionate about technical analysis and has been exploring the charts for years.


