Dollar Index – Market Crash Road Map – Full Elliott Wave Cycle

Dollar Index finalized in Jan 2017 an entire Primary ABC (blue) Structure, thus completing Cycle Wave A (black).
I detected a possbile Pattern which has good chances of materializing into a Market Crash.
It’s not going to happen tomorrow or very soon, however the Pattern is real and I am keeping my “hawk eyes” open.
Cycle Wave B (black) has been unfolding since then with an aggressive Down-Trend which, in Elliott Wave labeling, can only be treated as an Impulse.
Because of the fact that the recent Down-Trend unfolded in fast and deep manner, the Impulse could be labeled as a 3rd Minor (red) Wave within the larger degree Intermediate (C) (turquoise).
Therefore, I am suspecting Dollar Index to possibly start a Complex Corrective Structure on the Up-Side which would get its head above water around the 96-97 Levels.
Dollar Index – Weekly Chart:
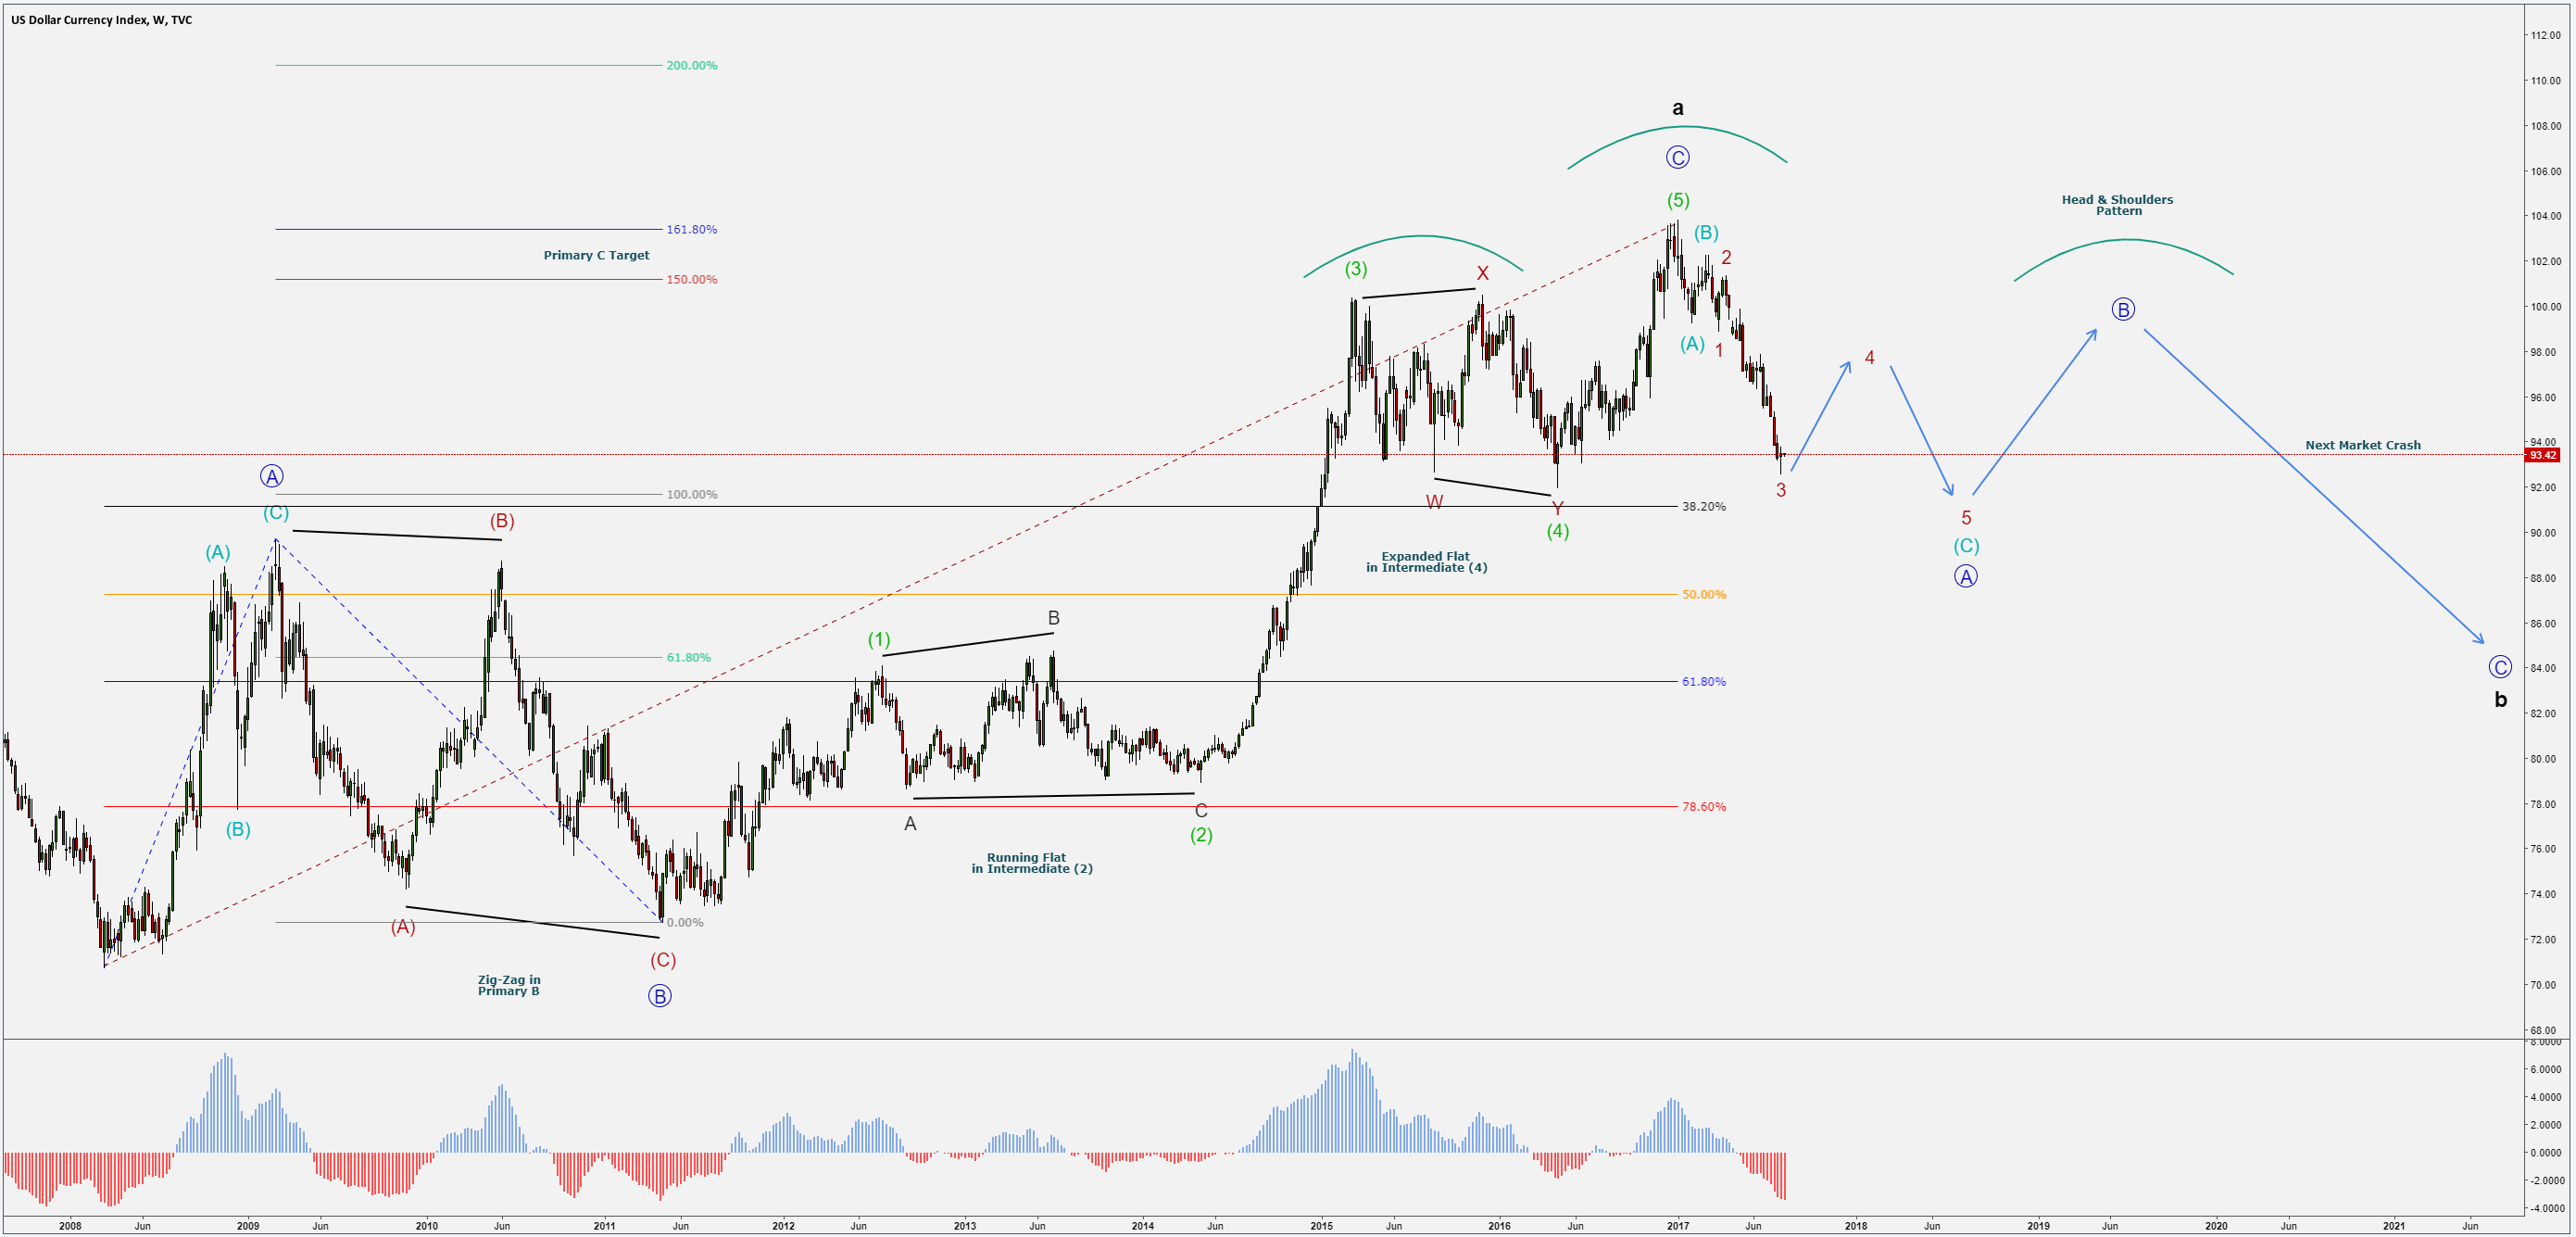
Dollar Index – Long-Term Wave Count – Cycle Wave A (black):
-
Primary A (blue) unfolded with a 3 Wave Bullish Sequence in its Intermediates (ABC) (turquoise). This happened during the 2008 Recession.
-
Primary B (blue) unfolded as a Zig-Zag in its Intermediates (ABC) (red), retracing overall almost the entire moves that Primary A (blue) has gained.
-
Primary C (blue) unfolded with typical 5 Swings Sequence, with a Running Flat Structure in Intermediate (2) (green) and an Expanded Flat in the Complex Corrective Structure within Intermediate (4) (green).
-
Intermediate (5) (green) ended its Bullish run during Trump’s Presidential Election.
That was that! We have a full Cycle, I am no no longer looking up for the Dollar Index.
With Intermediate (5) (green) ending, we could also consider that Primary C (blue) and Cycle Wave A (black) have also ended.
A very valid reason for this belief would be the fact that Primary C (blue) could be seen ending at the 150-161.8% Fibonacci Extensions of Primary Waves A & B (blue).
What does the ending of a Cycle mean? Now what?
Well, this would mean that the way would be paved for some more “shocks” in the Market which usually happens after a Market Shift in Trends Reversals.
After the recent fall in the Dollar Index we finally saw a bounce off the Aug 2015 & May 2016 lows. That was not a coincidence in my personal view, as those Levels pose as Significant Supports.
I am seeing this Support as the end of Minor 3 (red) and the possible start of a Complex Corrective Structure which would be formed out of 3 Swings.
I will be looking at the Structures closely and mark my updates accordingly but for now what I can say is that typically, I would expect a Head and Shoulders Pattern in the ABC Primary (blue) Waves.
Dollar Index – Daily Chart:
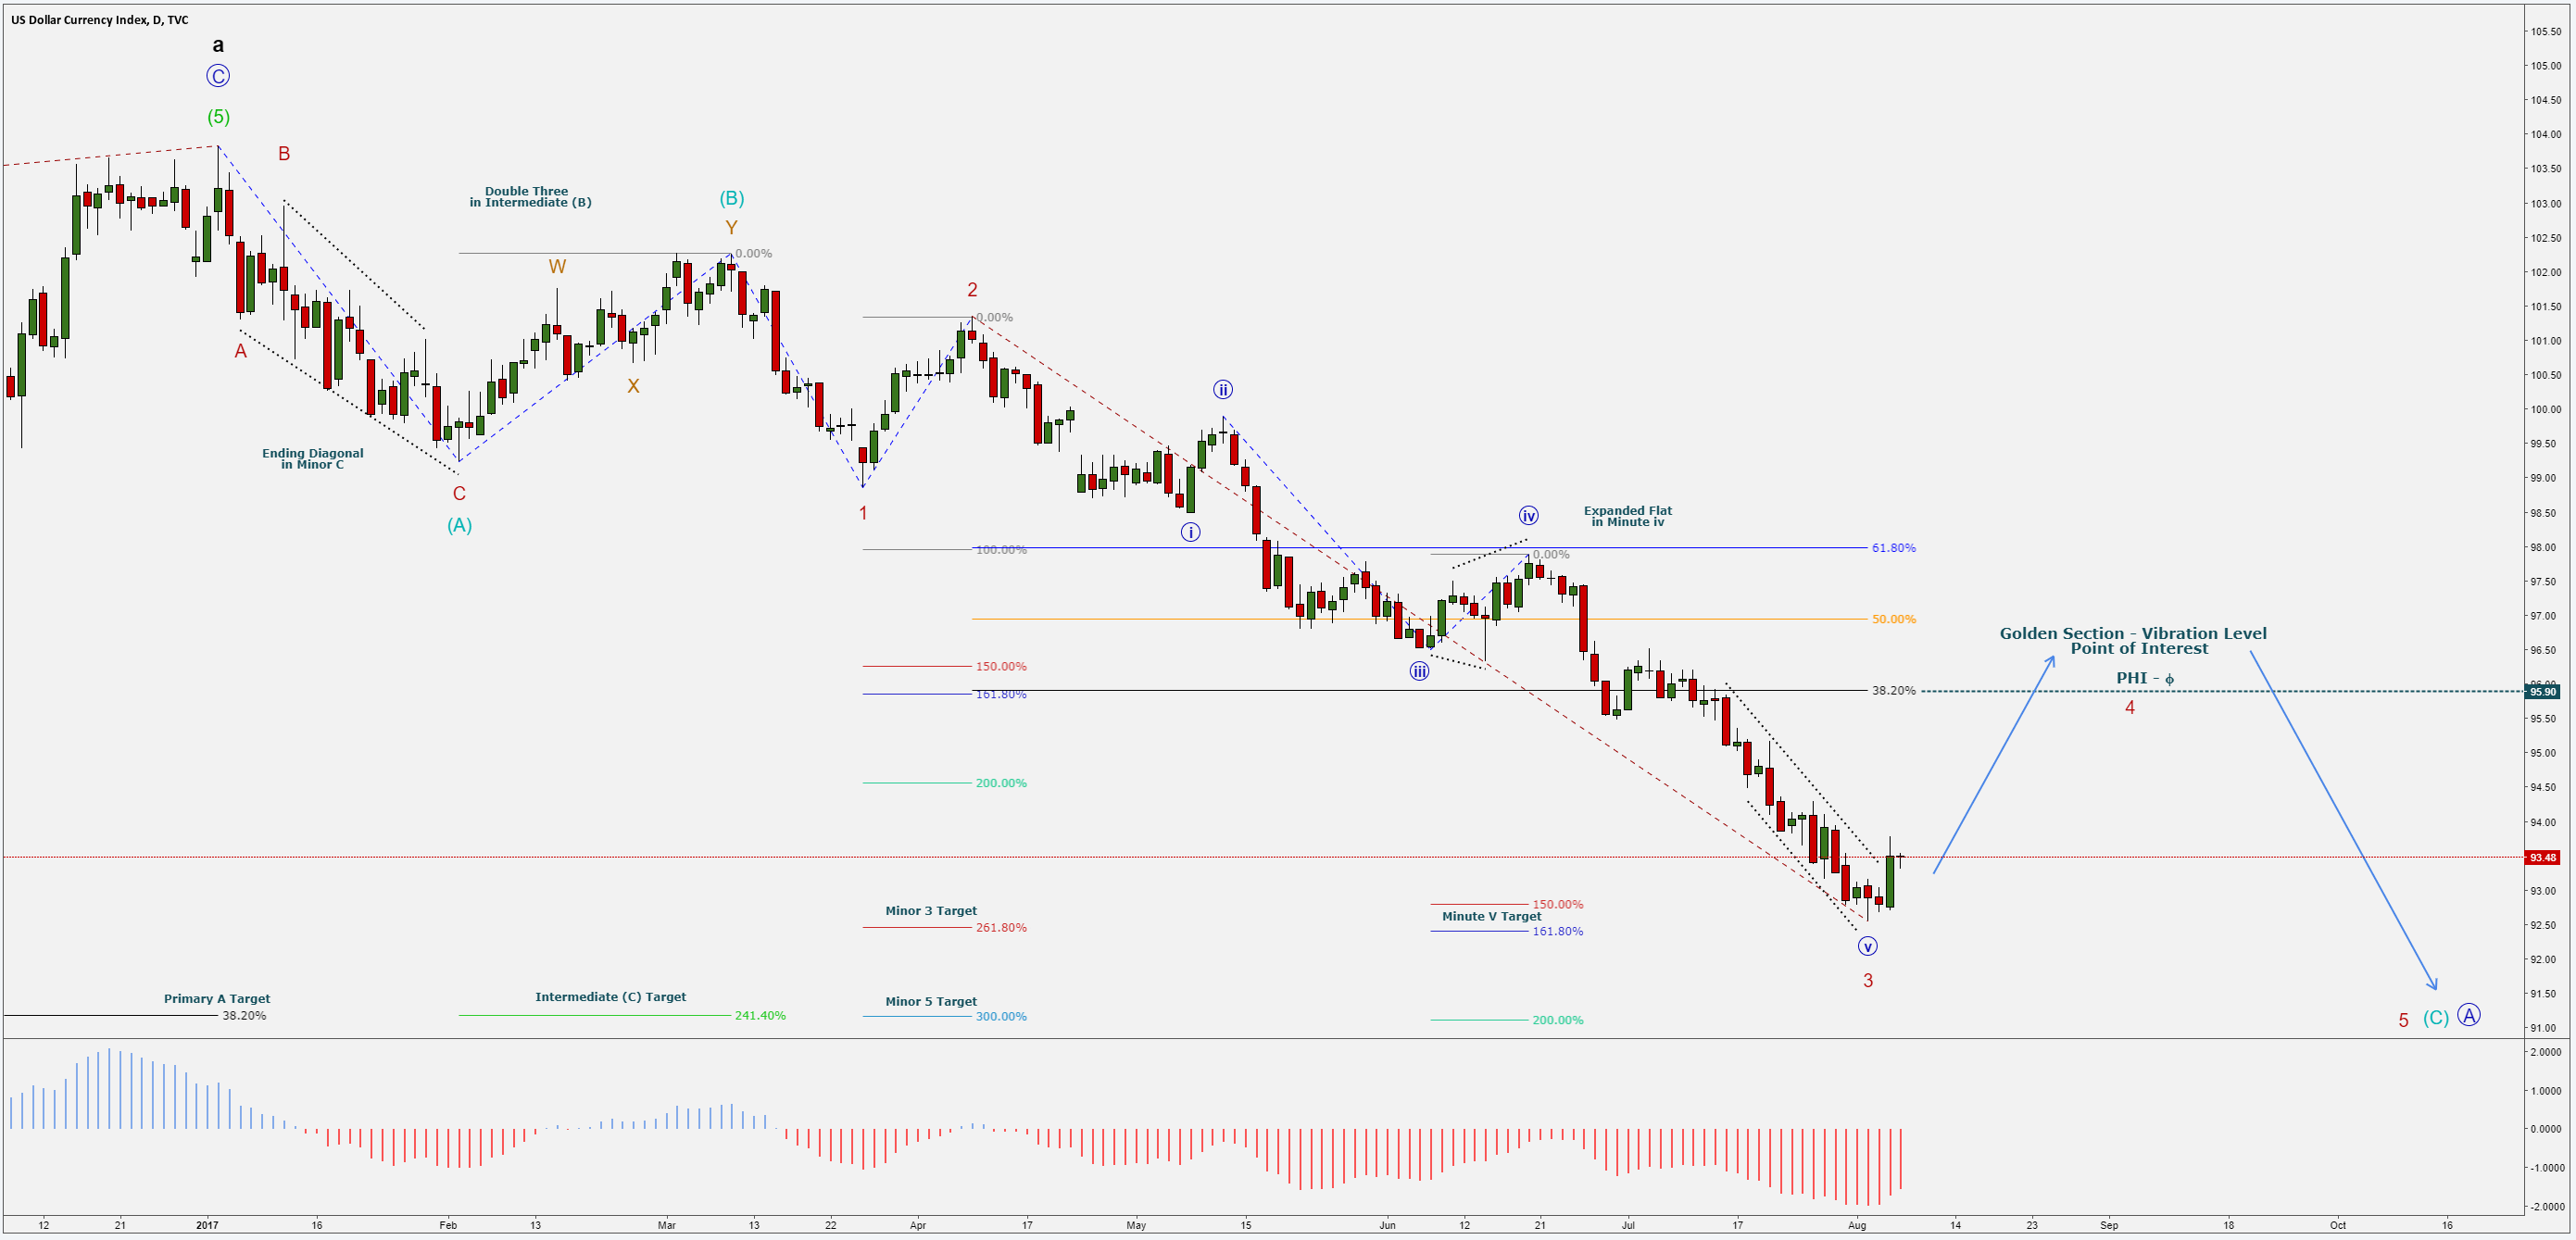
Dollar Index – Medium-Term Wave Count – Intermediate (C) (turquoise):
-
Intermediate (A) (turquoise) unfolded with 3 Swings Sequence in its Minors ABC (red) highlighting an Ending Diagonal in Minor C (red).
-
Intermediate (B) (turquoise) unfolded with a Complex WXY (orange) Structure, correcting 61.8% of Intermediate (A) (turquoise).
-
Intermediate (C) (turquoise) is in the spotlight and still unfolding, showing a clear Extension in its Minor 5 Waves Sequence.
Fibonacci Projections & Speculation:
-
Intermediate (C) (turquoise) is expected to end its Minor Waves (red) at or around the 38.2% Fibonacci Retracements of Cycle Wave A (black).
With Intermediate (C) (turquoise), so would Primary A (blue) find its end at or around the 241.40% Fibonacci Extensions of Intermediates A & B (turquoise). -
Minor 4 (red) is expected to unfold with 3 Swings Sequence (Minute ABC) and reach towards the Golden Section (PHI – ϕ), which is also a Vibration Zone and a Point of Interest.
-
Minor 5 (red) is expected to find bottom at the 300% Fibonacci Extensions of Minors 1 & 2 (red).
Dollar Index – 4H Chart:
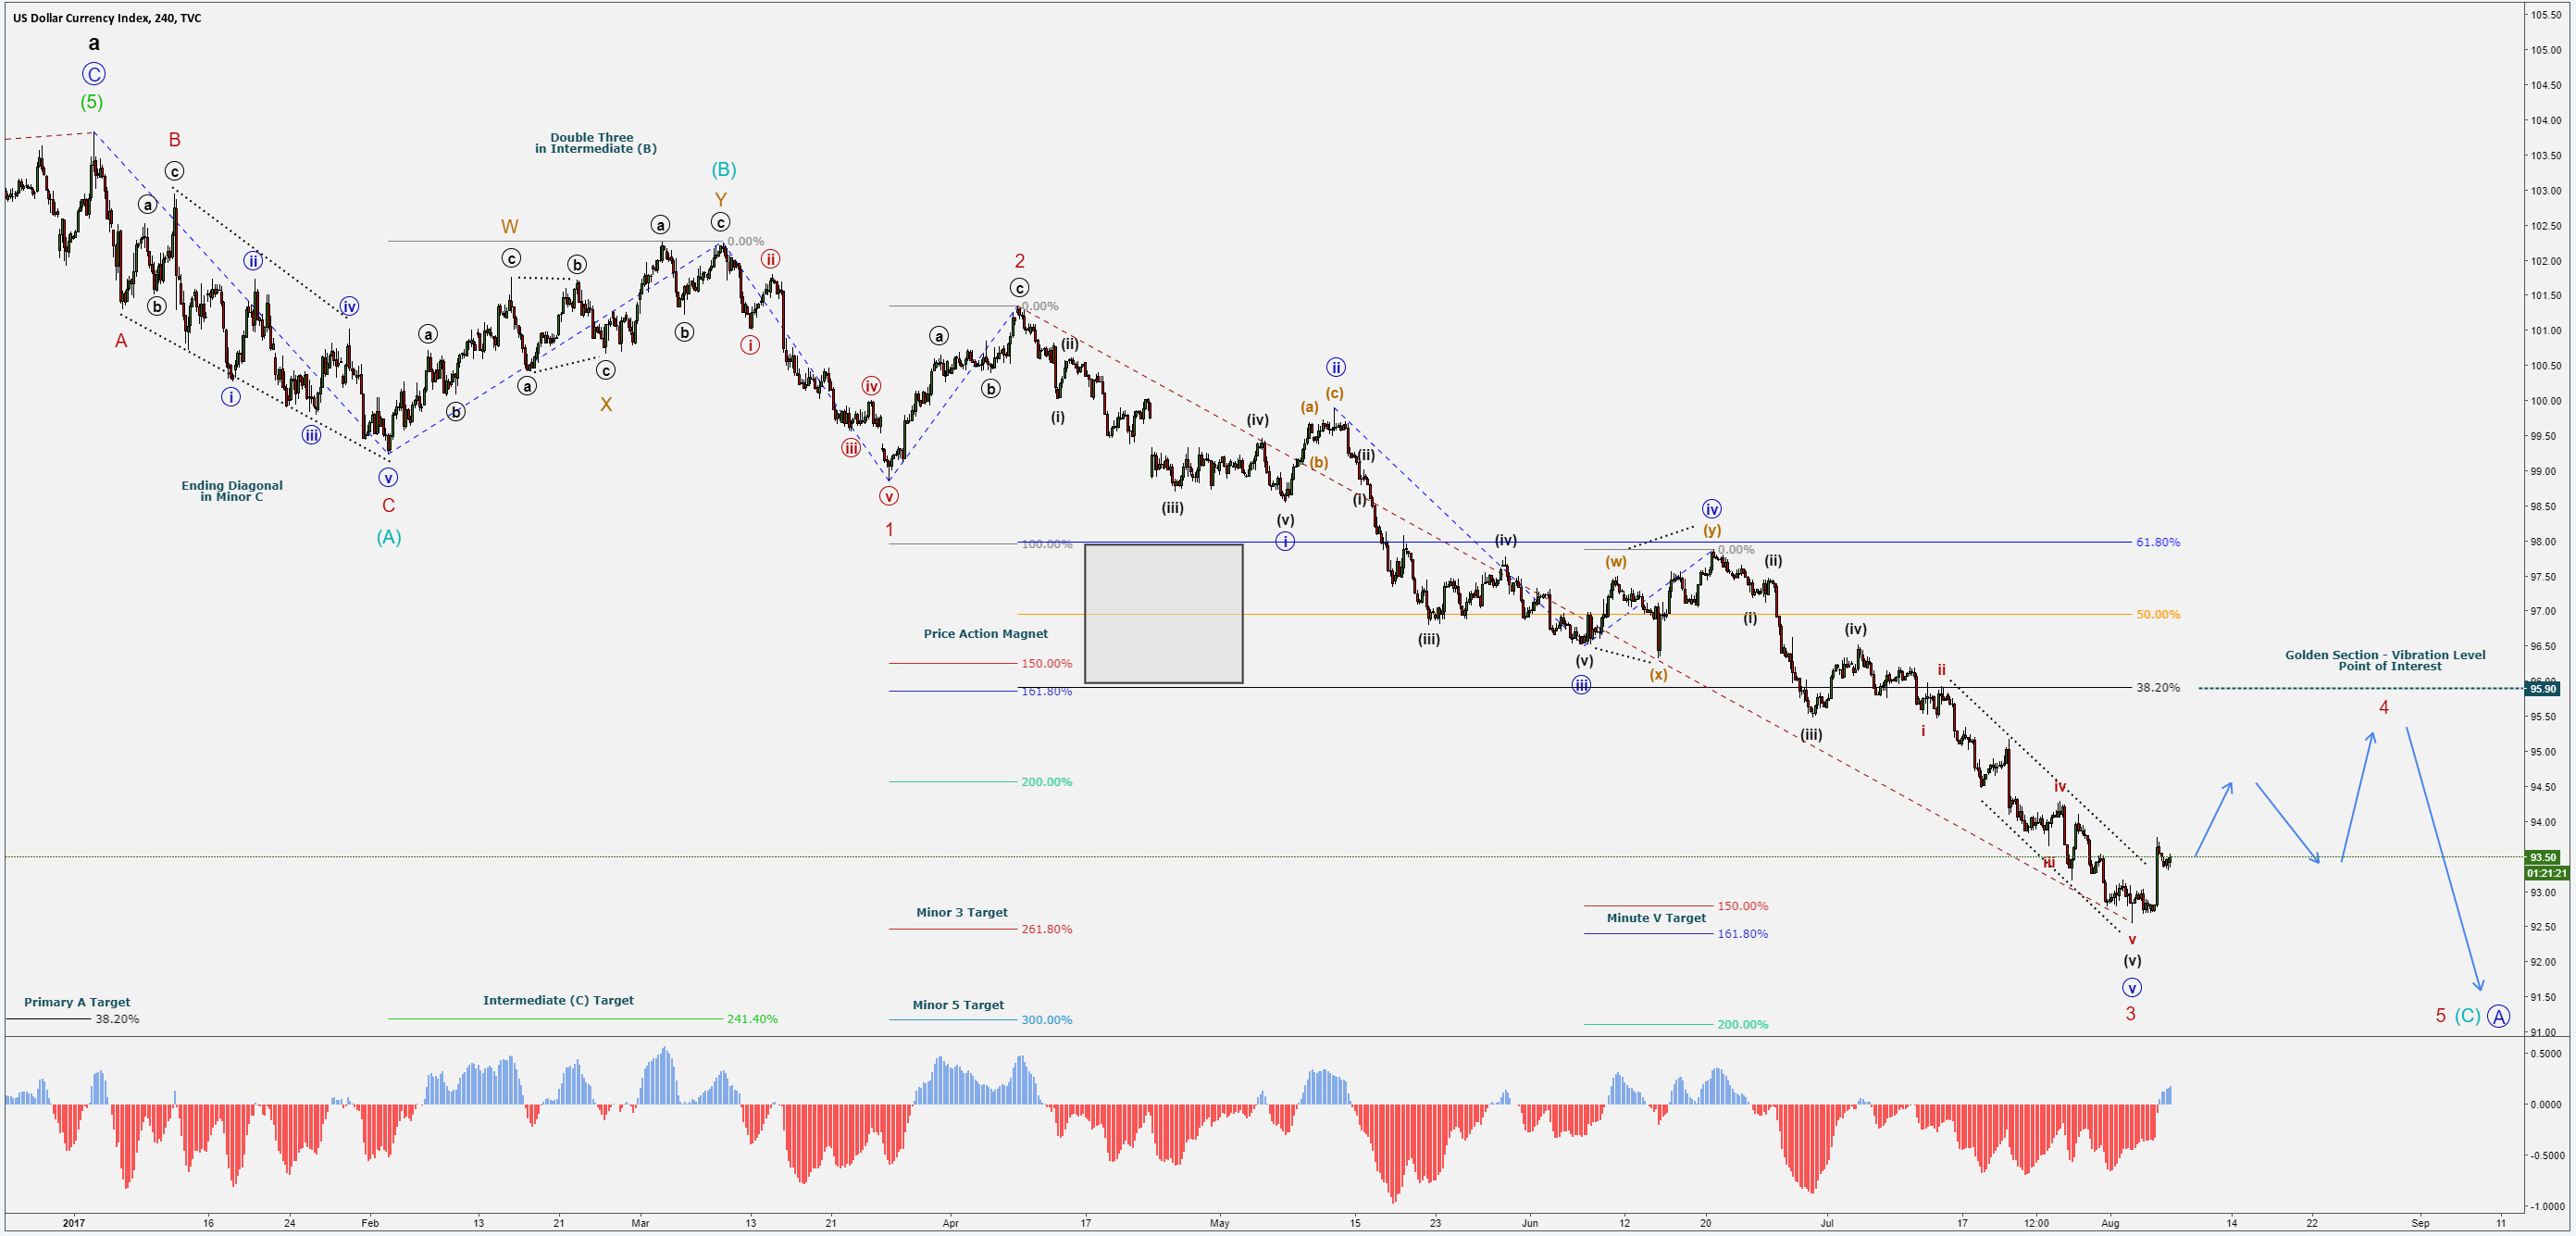
Short-Term wise I would expect a Bullish Swing for Dollar Index and Medium-Term wise I would expect further weakness before a Long-Term Recovery.
* The above Analysis does not act as a direct investment advice and should be treated as market commentary.
Many pips ahead!
RT
Author

Richard Tataru
XGlobal Markets
Richard is a market analyst and holds the role of Senior Account Manager at XGLOBAL Markets. He is passionate about technical analysis and has been exploring the charts for years.


