Euro performing well as Macron appears to win the first debate

Market Overview
Financial markets seem to have entered a rather quiet phase of trading, however the euro is performing well after a positive performance from Emmanuel Macron in the first live French Presidential debate. The French Presidential election also had the main candidates in a live television debate last night with the first round of voting just over a month away. Seen as doing well in the debate, the improved prospects of Emmanuel Macron recently have tended to leave markets fairly sanguine over the risks of populism driving a Le Pen victory, also providing support for the euro. The FOMC meeting pulled Treasury yields and the dollar lower, but there are now signs that this move is beginning to consolidate. That is impacting across forex markets and commodities, with a subdued start to the week. Direction could be found in the coming days with a raft of Fed speakers lines up to give views on FOMC monetary policy, with Janet Yellen set to speak on Thursday. The issue of Greece’s bailout is also back in focus after another meeting to release the next tranche of bailout failed to be agreeably resolved yesterday. Greece owes around €7bn in July and needs the next tranche in order to make the payment.

Wall Street was mixed again last night with the S&P 500 -0.2% at 2373 and with Asian markets also mixed, European indices are following suit today. Forex markets show the dollar as stabilising recent losses, whilst the euro is the main outperformer in the wake of Macron’s showing in the French Presidential debate. Gold and silver are marginally lower with the support for the dollar, whilst the oil price has also bounced slightly in early moves.
The impact of Brexit on the UK economy will be in focus for traders today, with sterling sure to find elevated volatility as a result. UK CPI inflation at 0930GMT is expected to print at +2.1% on the headline year on year CPI. This would be the first time since December 2013 that inflation had been at or above the Bank of England’s 2.0% target and the concern is that the rate of change is accelerating. The other watched for data point in the UK inflation will be the PPI Input Prices which are expected to remains eye wateringly above 20% (the highest since 2008) and will point towards a continuation of inflation increases in the coming months. The Government will also be hoping for a lower public sector borrowing number for February than the +£2.9bn expected. New York Fed President Bill Dudley is slated to speak at 1000GMT, whilst the first US data is at 1230GMT with the current account balance which is expected to deteriorate further into deficit to $129bn (from $113bn).
Chart of the Day – AUD/USD
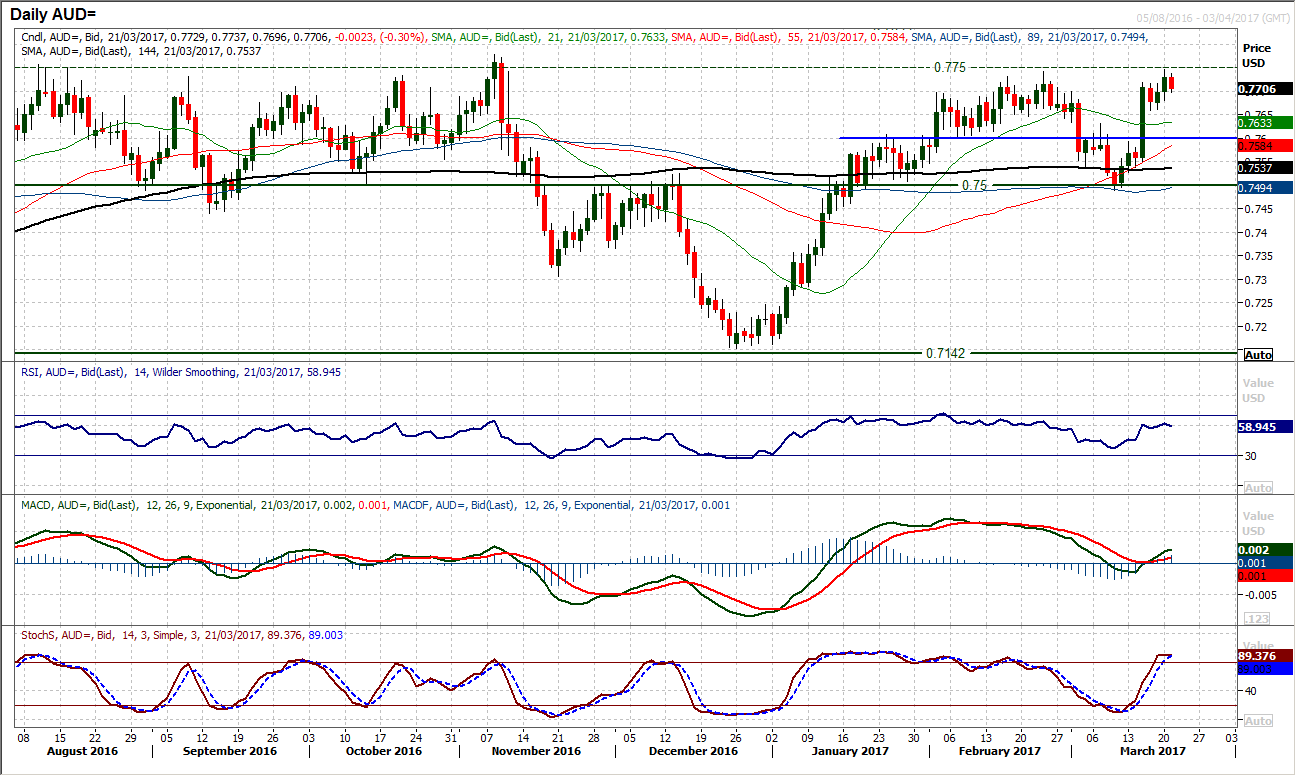
Helped by a dovish FOMC, the Aussie dollar rally over the past week has been impressive. However it is now coming into some major area of overhead resistance which will give the bulls a real hurdle to overcome. The resistance at $0.7740 limited the early 2017 rally and is again being seriously put to the test. Yesterday’s candle made a brief intraday move to $0.7747 before closing back below the resistance, in a corrective move that has continued early today following the RBA minutes. This now increases the prospect of this being resistance that is a level that protects the November high at $0.7777 which was another multi month resistance. Are the momentum indicators suggesting that the bulls have it in them this time? There may be a degree of room on the RSI which is around 60, but the MACD lines are underwhelming and Stochastics are now threatening to roll over. This is all reflected in the hourly indicators which have been bear diverging and falling away for several days now, with the RSI this morning hitting a one week low. The support band $0.7660/$0.7680 will become increasingly important near term now as a breach would confirm the broken positive outlook and re-pen the $0.7600 pivot.
EUR/USD
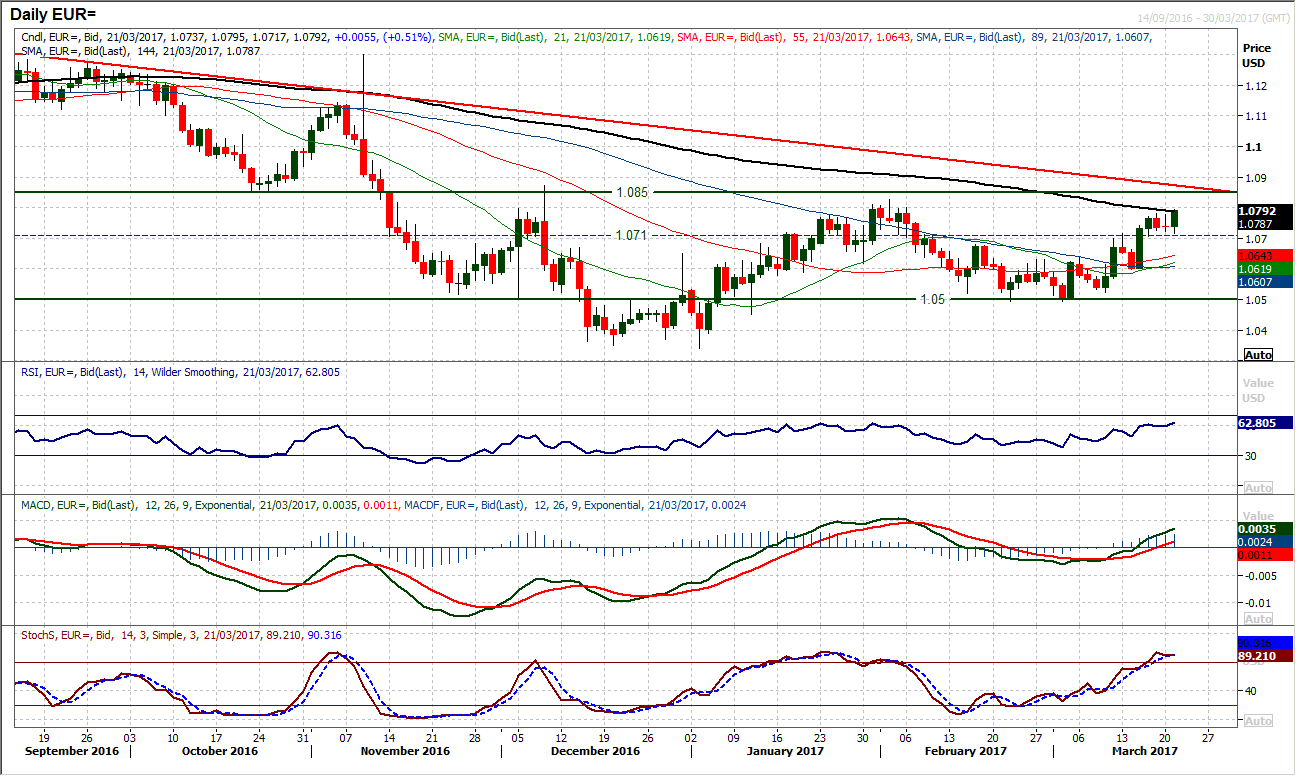
The euro continues to consolidate on its breakout above $1.0710. The last three sessions have been a real mish mash but yesterday’s doji candle reflects a lack of certainty over the session, but as long as the market remains supported above the $1.0710 breakout, the bulls will remain in control. This comes with momentum still positively configured and despite the RSI just consolidating recently, it remains above 60 with the Stochastics in bullish set up. The hourly chart shows a consolidation of around 70 pips in the past few days and a decisive break would open a move of similar magnitude either way. There is little indication on the hourly momentum which is range bound, however, with the early gains today, the bulls are looking higher one more towards the next resistance at $1.0800/$1.0850. There is still a sense that even if the market were to break support at $1.0710 it would still be part of a sequence of higher lows over the past three weeks.
GBP/USD
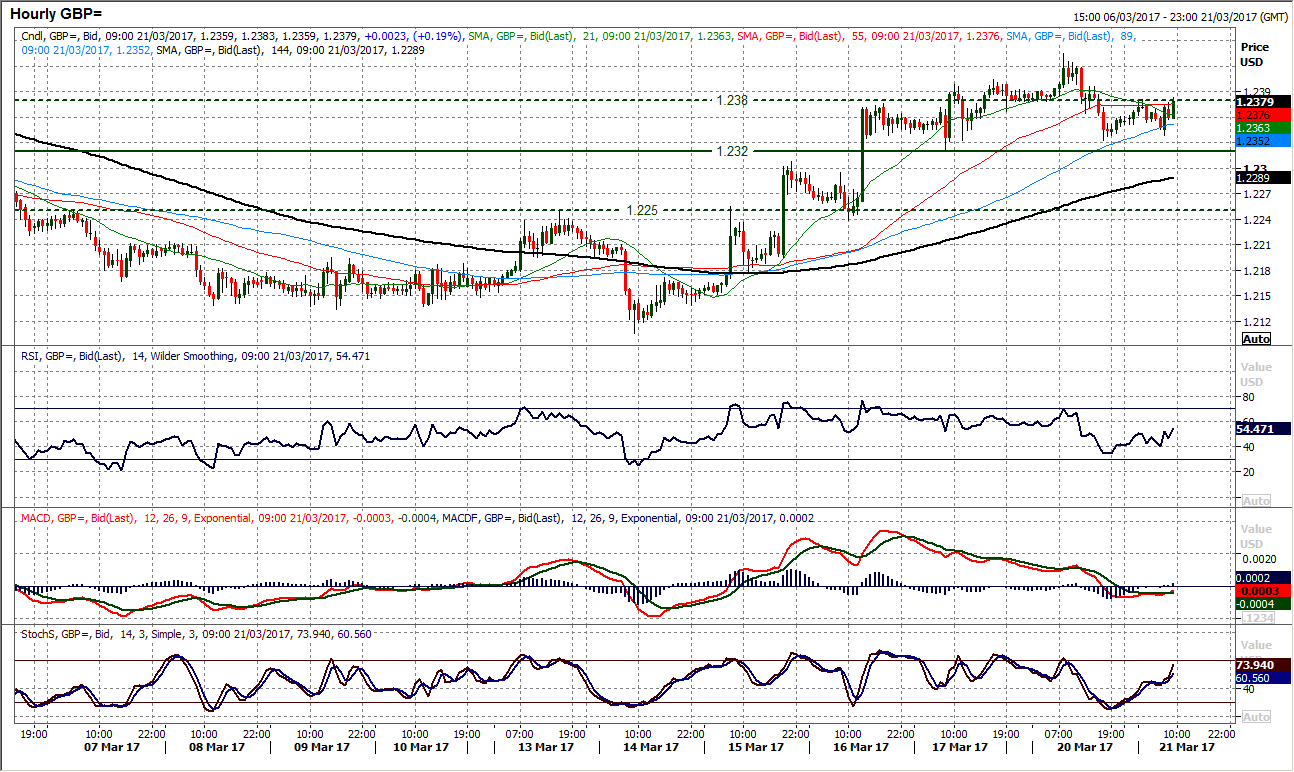
Rallies on Cable still look to be a chance to sell and the recent recovery into the overhead supply of February’s trading range now looks to be another chance to sell. The magnitude of the recovery candles had been waning over the back end of last week and yesterday’s bearish candle has posted resistance at $1.2435. This now seems to be an important moment for the bulls in this recovery as the daily momentum indicators begin to tail off. A second daily close lower, and below the old support at $1.2345 would suggest that the bulls have deserted the rally. The hourly chart shows a higher low at $1.2320 which if broken would complete a small head and shoulders top pattern. This would also then give a 125 pip implied downside target. Already we see the hourly momentum indicators more correctively configured and hourly moving averages beginning to roll over. There is near term pivot resistance around $1.2380 now, with $1.2250 the next key near term support.
USD/JPY
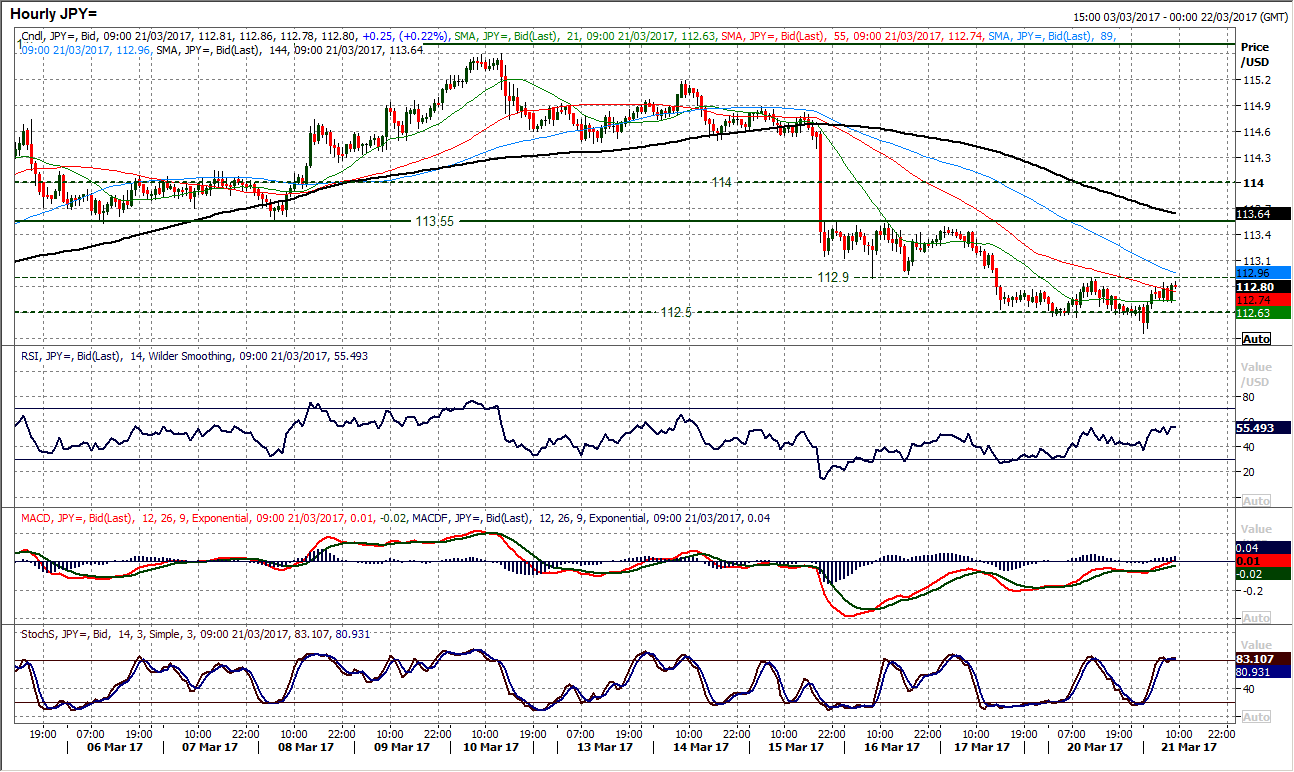
Can the dollar regain its poise once more? The corrective move within the range has started to form support as the key old floor around 112.50 has been reached. The ultimate low within the range is 111.60 but there is clearly a band of key lows that the market still has in mind within the range now. The support has only been minor so far, but if the bulls can hold on to the early gains to post a bull candle the outlook will begin to improve. The momentum indicators are still under pressure with the Stochastics still falling (usually you would expect the Stochastics to be the first to react higher in a recovery situation, being the more sensitive to near term price action). The hourly chart shows an improvement in momentum but nothing yet confirmed in a sustainable recovery. Look towards the hourly RSI hodling above 60 and the hourly MACD lines above neutral. Near term resistance is with yesterday’s high at 112.90 which was also a minor pivot of Thursday’s low. The key overhead resistance in the range remains 113.55.
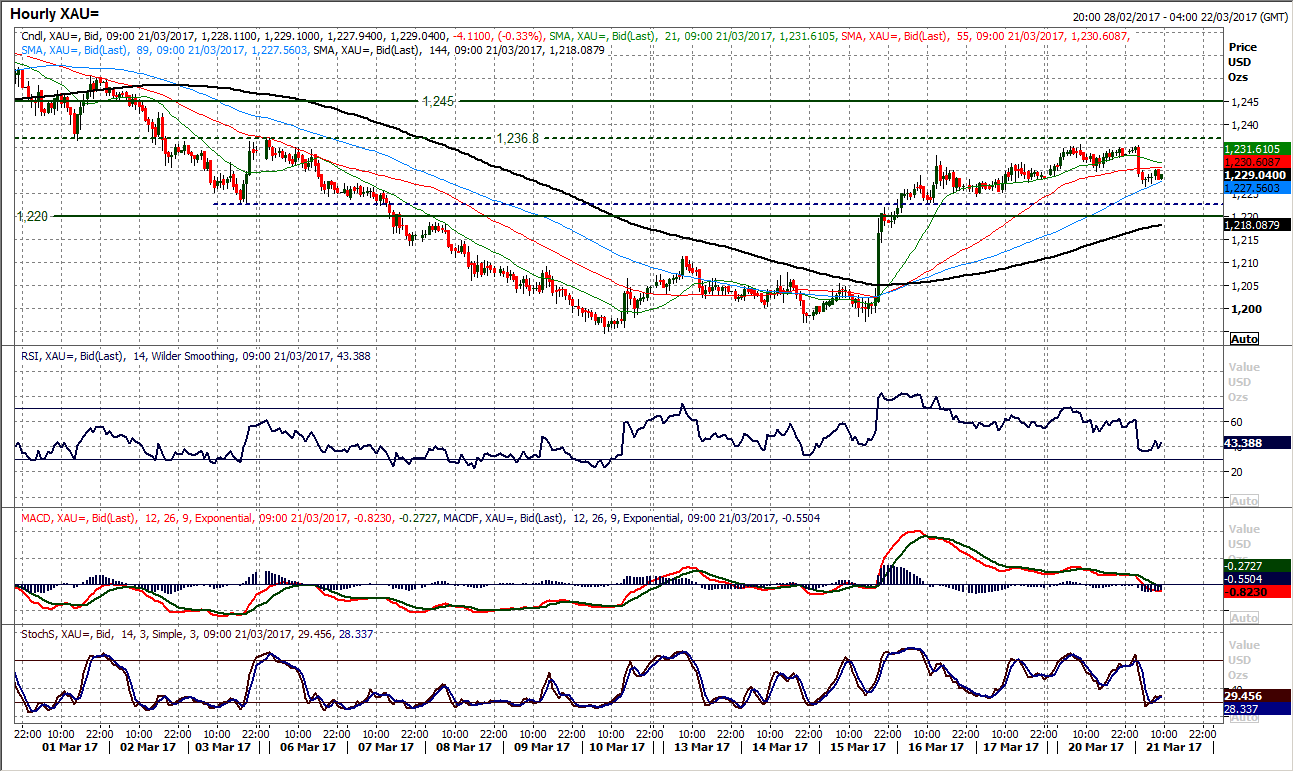
Gold
The prospective turnaround in sentiment for the dollar has also been seen on the price of gold which has just started to consolidate. The recovery in gold above $1220 changed the outlook into one which the bears are no longer in control. However I believe that the bulls will struggle too and the market is going to become increasingly choppy in a trading range scenario. The price pulled higher for a fourth straight positive close last night but the momentum looks to be waning with the overnight dip. The improvement in the momentum indicators is starting to fade. This is showing in not only the daily chart, but also the hourly chart too. A mild negative divergence across the RSI and MACD lines in the past two days comes with the resistance now forming at $1235.50. The reaction to the early decline could be very telling of the strength of the bulls, being that this is the first real test of this recovery. The hourly chart shows $1236.80 as initial resistance but there is also a band of medium to longer term resistance between $1240/$1245 which suggests that this bull recovery will need the bulls to be decisive and strong to continue.
WTI Oil
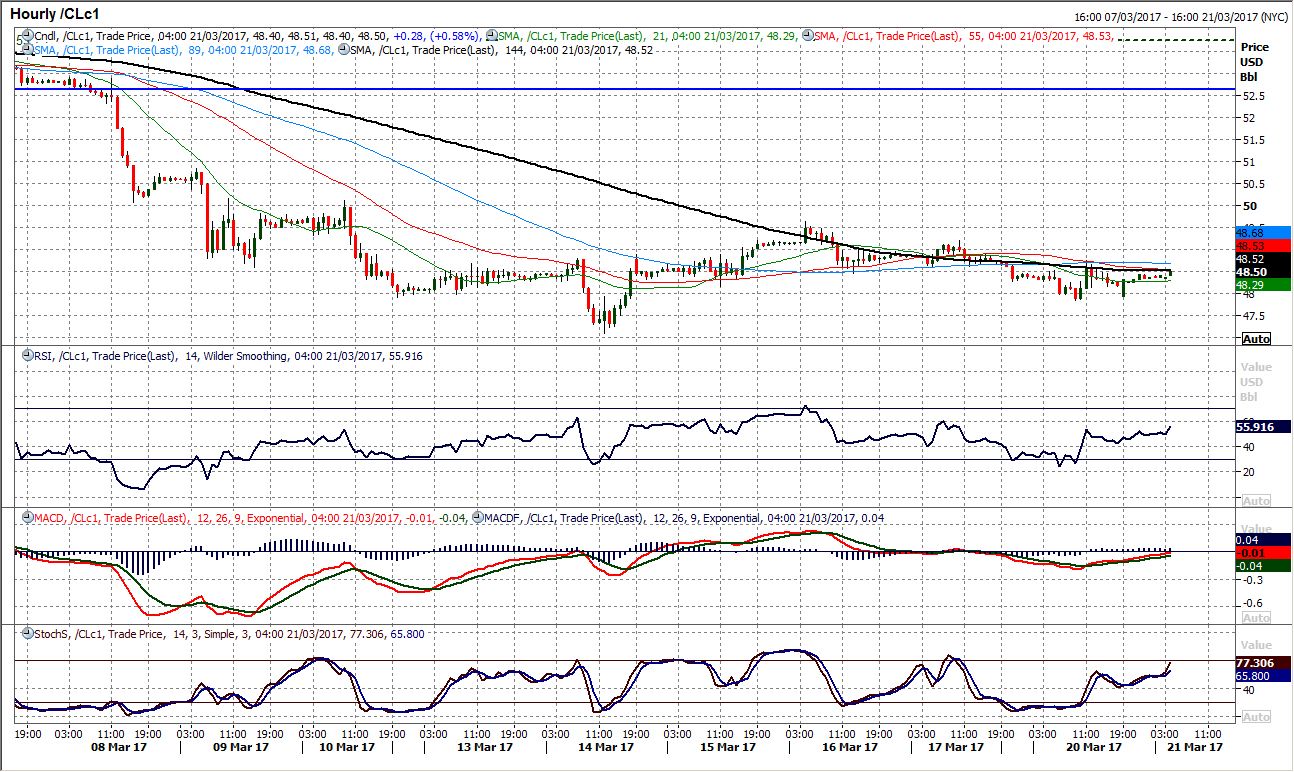
The rally from early last week has now decisively run out of steam as another bear candle seems to have left a key resistance in place around the old support band $49.60/$50.00. The momentum indicators are now strongly bearishly configured with the RSI turning back towards 30 again whilst the Stochastics have also rolled over in bearish territory again. Rallies remain a chance to sell on WTI now and the argument for there now being a key lower ceiling between $49.60/$50.00 is growing. The hourly chart shows near term negative configuration and that a slightly lower high has now been formed at $49.20. A move back below yesterday’s low at $47.85 would re-open the key $47.10 low. It will be interesting to see how the bulls react to the early rebound today, however, the confirmed breakdown below the old support band implies a $46.45 downside target with the next key support around $44.80.
Dow Jones Industrial Average
With another very neutral candlestick pattern to start the week, there is still little real sign of the consolidation ending any time soon. This support does though come in with the uptrend since November increasingly close. The bulls have been unable to find the upside traction in recent days and the trend higher is now going to be threatened if the market continues to fail on the upside. The trend support comes in today at 20,894 and interestingly is now above the corrective band of support 20,777/20,850. The momentum indicators retain their configuration of a bullish bias with the RSI above 60 and the Stochastics having arrested their recent decline. The hourly chart reflects this mild positive bias too, with the consolidation above Thursday’s low at 20,894 and the momentum indicators settled in positive configuration but with upside potential. The bulls are though struggling at the post FOMC reaction high at 21,000 which is growing as a near term resistance.

Author

Richard Perry
Independent Analyst


