EURGBP: A Trade Setting Up Closer to the Election

There is an opinion held in some quarters that news is created to explain market movement. Whilst I would not go so far, there has certainly been no shortage of news to explain the volatility of the past day. This week, I developed several trades in the GBPUSD and XAUUSD. As we approach the race to cover more news, we can expect increased volatility. Nonetheless, there do not appear to be reasonably safe trades in the majors to engage in. EURGBP provides an alternate method of gaining exposure to the events about to occur.
Figure 1: EURGBP Daily – Elliott Wave Count
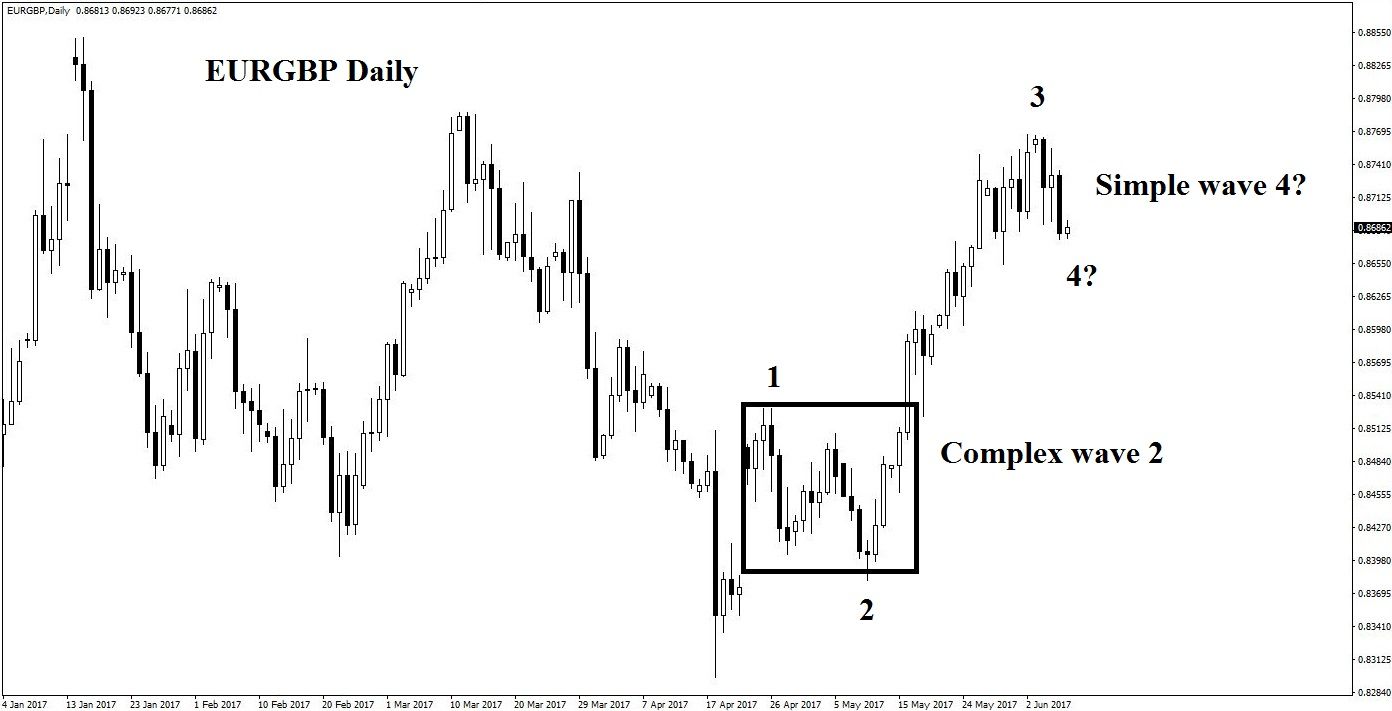
The daily chart of this pair is suggestive, having just created what appears to be an impulsive third wave in a five-wave structure. By the famous “rule of alternation”, since wave 2 was a complex retracement, we might expect wave 4 to be simple, and for its termination to occur soon. In other words, we might have the opportunity to enter a long on this pair on a lower timeframe.
Figure 2: EURGBP Four-hourly Chart – Hidden Support
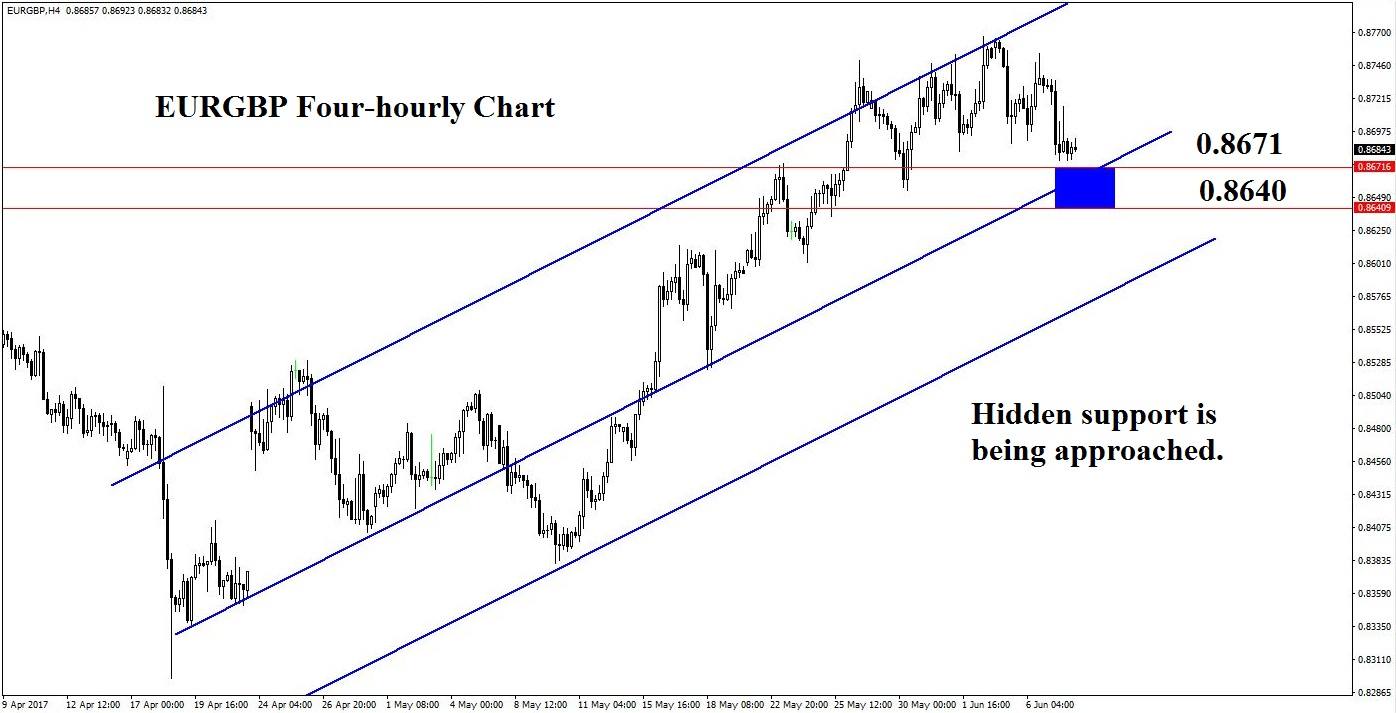
An examination of the four-hourly chart suggests that there may be a hidden trendline that is being approached. This, bolstered by several other methods of analysis, suggests that the 0.8640-0.8671 region may prove supportive. This Blue Box is on the verge of being activated, and it its quite likely that it will in the hours to come. As a result, we would prefer to use the hourly chart for a more precise entry point.
Figure 3: EURGBP Hourly Chart – Trigger Chart
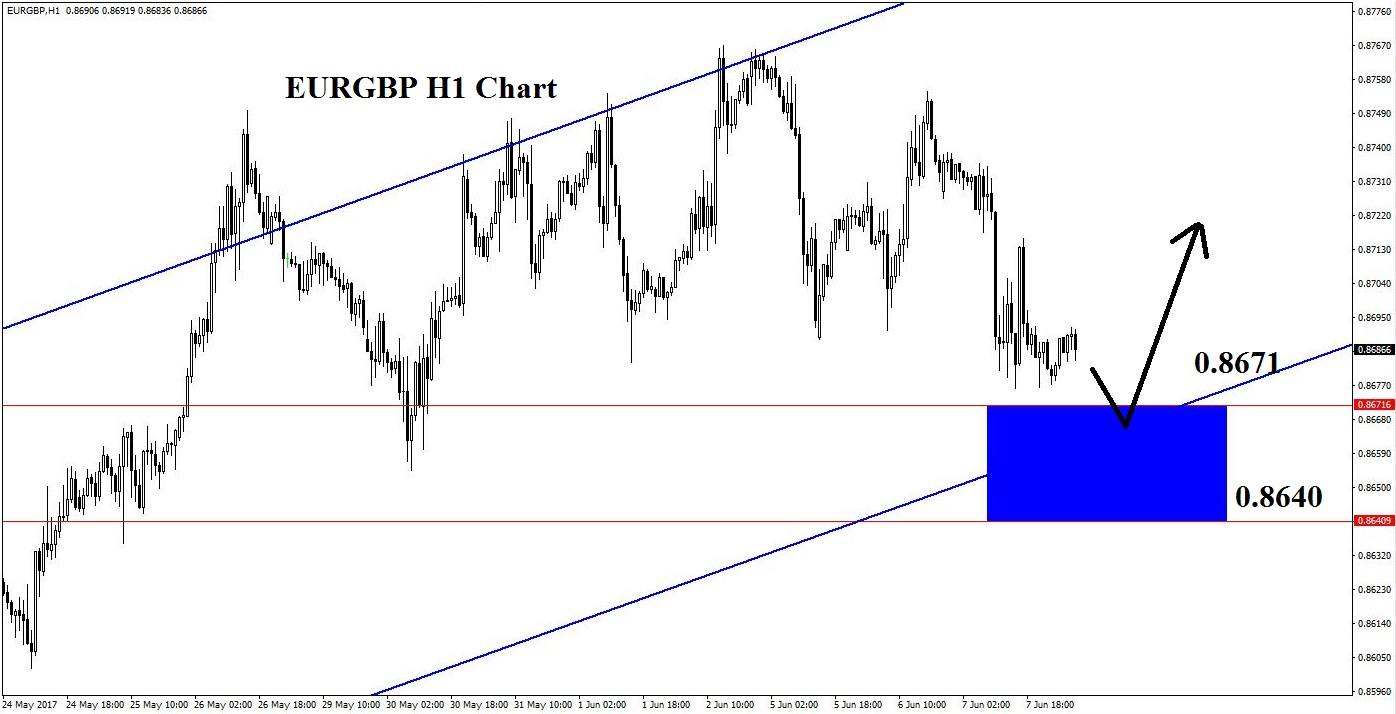
The hourly chart shows prices consolidating just above support. Once it touches the Blue Box, it is most likely that an (8, 2, 2) stochastic cross with a breakout above the candlestick corresponding to the cross would complete the trigger requirements. Of course, traders could opt to use other entry methods, such as fast moving average crosses or divergence, as well as trendline breaks. Although accuracy would be lowered in higher volatility environments, we would still stick to the rule of thumb that each Blue Box deserves two attempts to produce results.
Author

Kaye Lee
Straight Talk Trading
Kaye Lee holds an MA in Economics and Law from the University of Cambridge. He is the Head Trader Consultant for Straight Talk Trading and Trades Happening Now.


