EUR/USD starts another correction, gold rallies

Key Highlights
- EUR/USD failed near 1.1495 and started a downside correction.
- It traded below a key bullish trend line with support near 1.1385 on the 4-hours chart.
Looking at the 4-hours chart, the pair started a downside correction below the 1.1450 level. The pair spiked below the 38.2% Fib retracement level of the upward move from the 1.1124 swing low to 1.1494 high.
Besides, there was a break below a key bullish trend line with support near 1.1385 on the same chart. It tested the 100 simple moving average (red, 4-hours) and the 200 simple moving average (green, 4-hours).
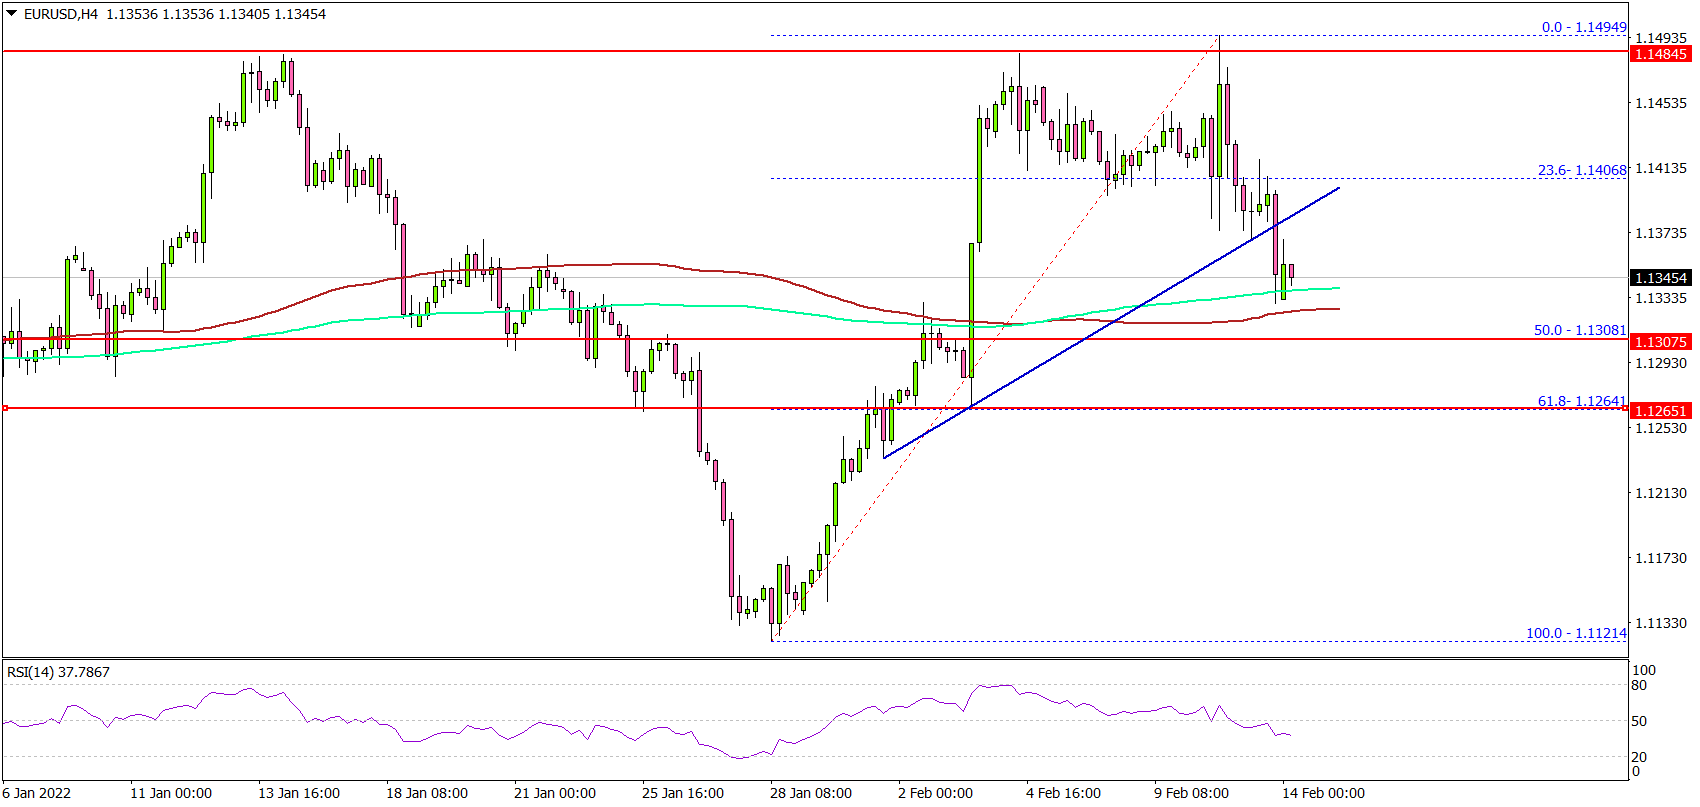
The next major support is near the 1.1310 level. It is near the 50% Fib retracement level of the upward move from the 1.1124 swing low to 1.1494 high.
Any more losses could push EUR/USD towards the 1.1250 support. On the upside, the pair might face sellers near the 1.1400 level. The main breakout resistance is still near the 1.1480 and 1.1500 levels.
Author

Aayush Jindal
TitanFX
I have spent over six years as a financial markets contributor and observer, and possess strong technical analytical skills. I am a software engineer by profession, loves blogging and observing financial markets.


