EUR/USD: Running on fumes

The past several days have been especially intriguing, given the market's reactions to the AstraZeneca vaccine news and the latest developments in Washington. Gold tumbled yesterday as mounting, promising evidence underpins the development of a viable vaccine against the coronavirus. This market reaction demonstrates the sudden decrease in global demand for safe-haven assets and other low-risk securities.
Overall uncertainty continued to falter today, as Donald Trump started to relent on the Presidential transitionary process. He allowed President-Elect Joe Biden and his team access to the White House, and various administrative procedures and agencies. Even though Trump continues to refuse to concede, the market interpreted today's developments as representing another step further towards the successful transition of power.
The persisting risks to growth are thus tilted to the downside, as far as the general market is concerned, which is likely to support the US dollar finally. The greenback has gone through a difficult patch, as the last scramble for low-risk securities drove the demand for the world's most popular currency down. Nevertheless, the tide of the aggregate supply and demand dynamics seems to be shifting, which could lead to another reversal for the EUR/USD.
1. Long-Term Outlook:
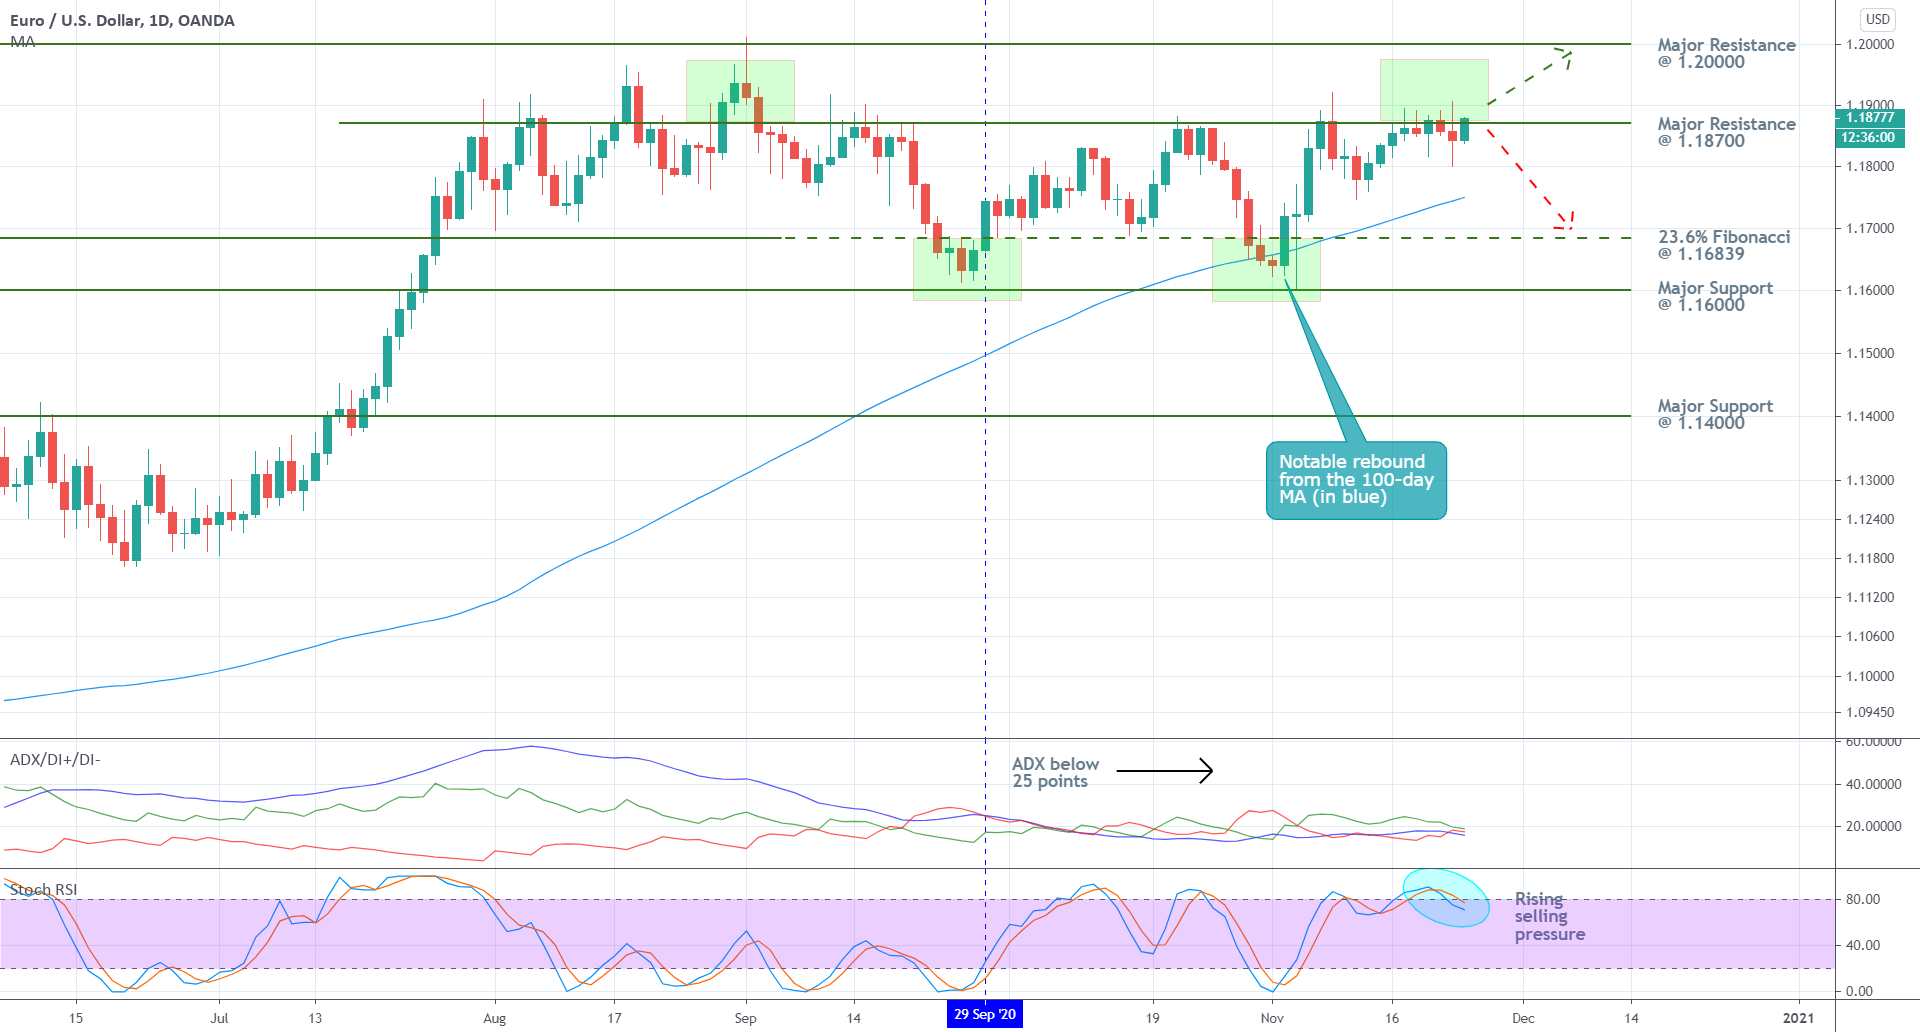
As can be seen on the daily chart below, the pair remains concentrated within the boundaries of a clearly visible range, which spans between the major resistance level at 1.18700 and the 23.6 per cent Fibonacci retracement level at 1.16839. Given that the price action has consolidated around the upper border of the range for seven consecutive days, a new bearish correction seems more likely with every passing day. The aforementioned fundamentals could trigger such a rebound.
The ADX indicator has been threading below the 25-point benchmark since the 29th of September, which confirms the robustness of the range-trading environment. Such market conditions substantiate expectations for sudden price reversals from either of the underlying range's extremes. Moreover, the Stochastic RSI indicator is just now starting to exit out of its 'Overbought' extreme, which demonstrates that more and more traders weigh in on such a reversal.
If the price action does indeed start to depreciate, its next target level would be the lower limit of the range – the 23.6 per cent Fibonacci. Before the price action can reach it, however, it would have to break down below the 100-day MA (in blue), which is serving the role of a floating support. As can be seen, the price action already rebounded from the moving average the last time the pair reached it, which was when the MA converged with the Fibonacci support. Therefore, the market bears should be especially observant the next time the price action tests the 100-day MA.
Conversely, if the underlying market sentiment were to change unexpectedly (similarly to what happened with gold yesterday) and the price action manages to break out above the major resistance at 1.18700 decidedly, then the next target for the renewed bullish momentum would be the major resistance level at 1.20000. The latter bears significant psychological importance – it was reached only once since April 2018, and the price rebounded almost immediately afterwards.
2. Short-Term Outlook:
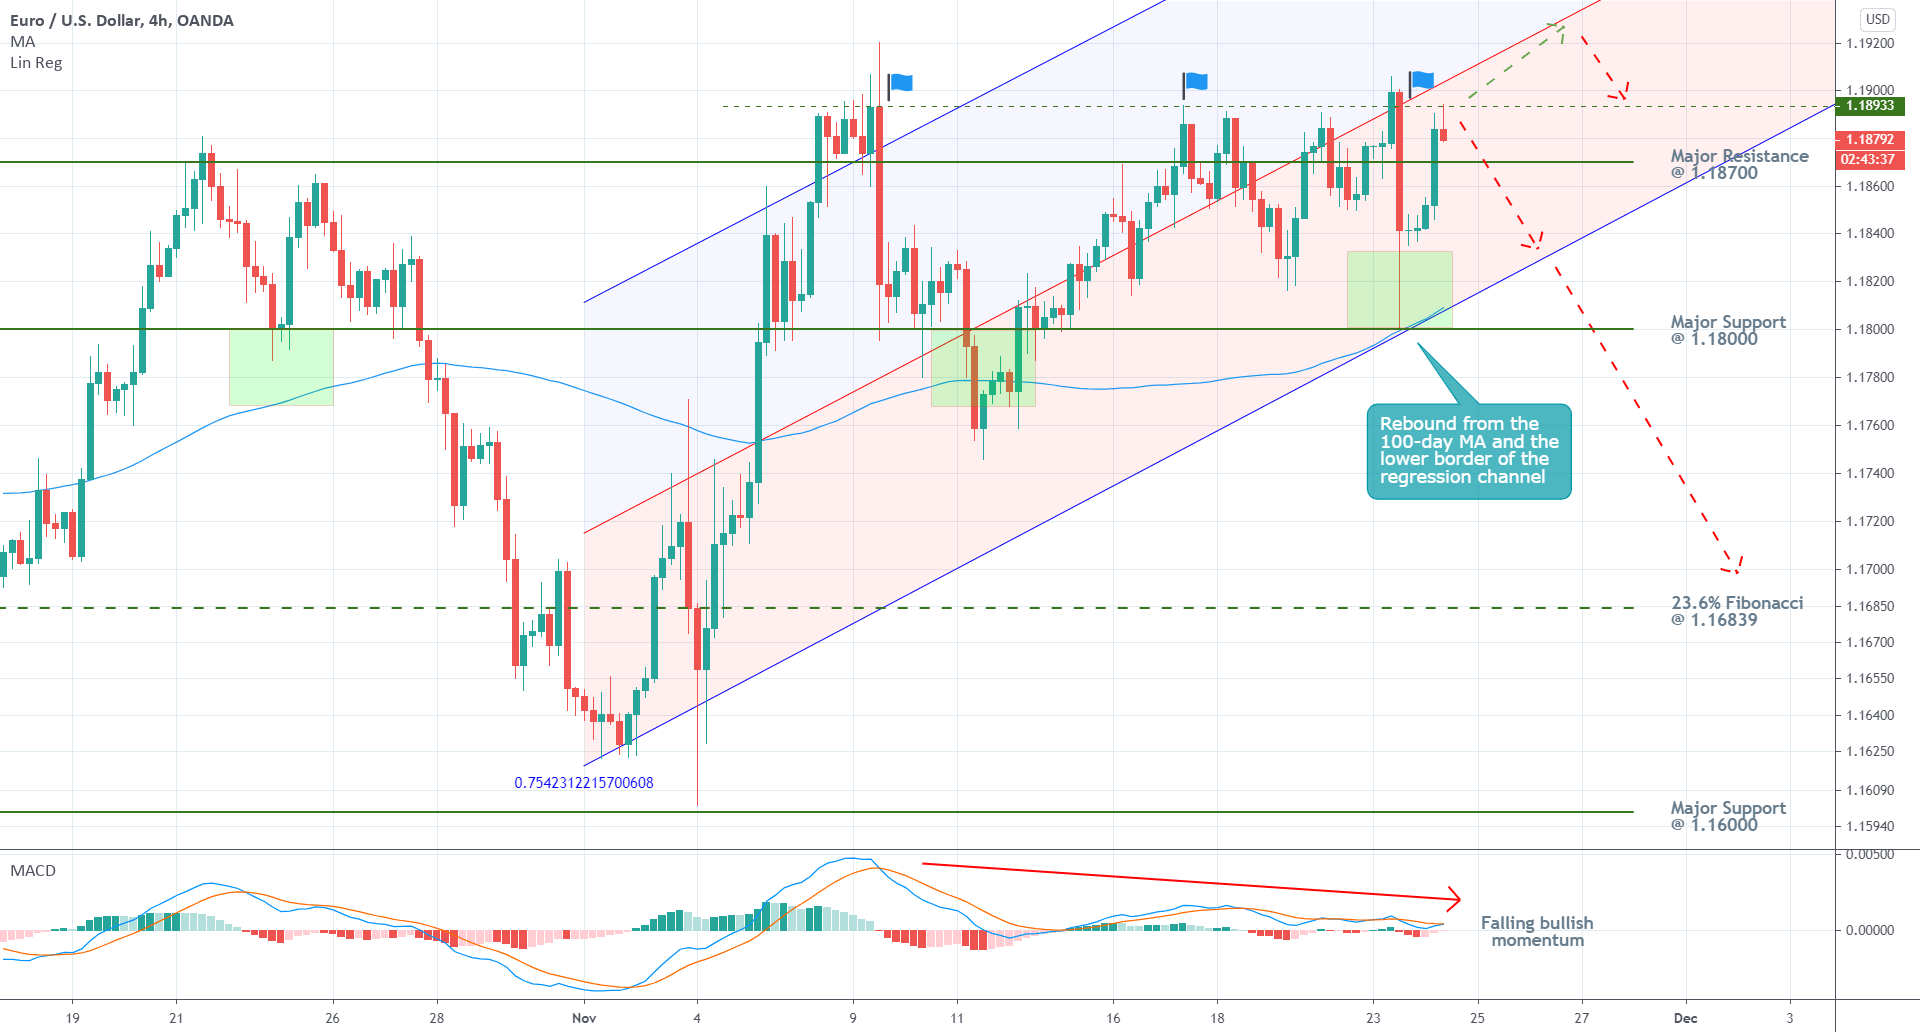
The behaviour of EUR/USD's price action in the short-term is even more demonstrative of a likely bearish reversal. As can be seen from the 4H chart below, the pair has already tested the resistance at 1.18933 on three separate occasions (the three flags). All of them turned out to be failed attempts at a breakout, which further supports the expectations for another reversal.
Notice also that a regression channel tool is applied to the latest upswing. The price action has consolidated around its middle line for quite a while now, and another rebound towards the channel's lower edge seems highly probable. This is confirmed by the fact that the underlying market momentum has been consistently falling since the price action established the peak of the latest upswing.
Before the price action can start depreciating towards the channel's lower boundary, however, it would have to penetrate below the psychologically significant support level at 1.18000. Notice also that the last time the price action reached this level, it rebounded. Moreover, it rebounded by leaving a massive lower shadow on the corresponding candle, which also tested the lower edge of the regression channel and the 100-day MA. In other words, the expected downturn could potentially be temporarily suspended around 1.18000.
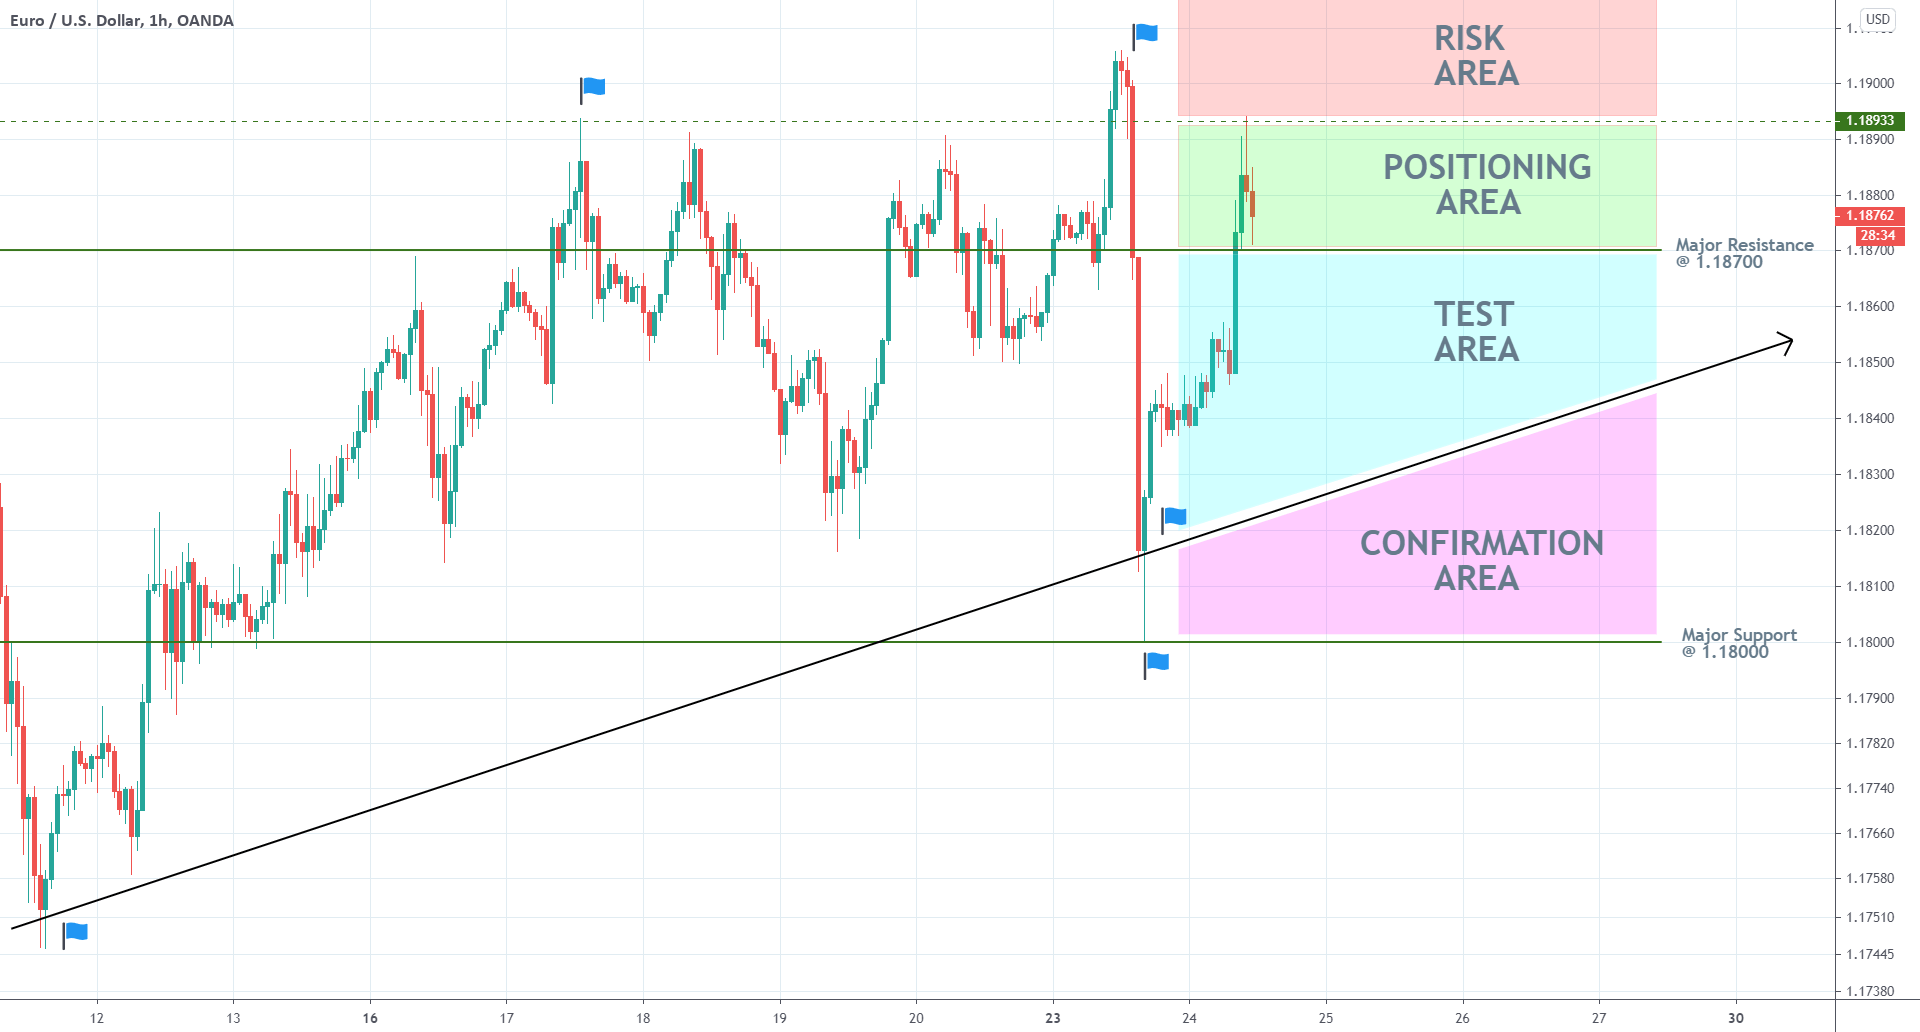
Given the underlying range-trading sentiment, market bears can use contrarian trading strategies to utilise the current setup. As can be seen on the hourly chart below, there are several areas of key interest. Less risk-averse traders can look for entry opportunities within the 'Positioning Area', whereas more risk-averse traders could wait for a breakdown within the 'Test Area'.
The 'Risk Area' underscores the threat of more adverse fluctuations and false breakouts above 1.18933, while the ascending trend line demonstrates the likely levels where the new downtrend could experience temporary disruptions.
Once the price action manages to penetrate the 'Confirmation Area', the strength of the underlying bearish pressure would be confirmed. Hence, bears with open positions can look for opportunities to add to them, whereas other traders could look for opportunities to apply trend-continuation strategies, on the condition that the price action establishes a minor bullish correction. The primary target level remains the 23.6 per cent Fibonacci retracement at 1.16839.
3. Concluding Remarks:
While the underlying setup looks fairly solid, in that the price action seems poised to head towards the lower end of the aforementioned range, traders should be cautious when placing orders. As was seen yesterday with the price of gold, sudden ripples could invalidate the underlying ranging conditions. Hence, traders are better-off using narrow stop-loss orders.
Author

Plamen Stoyanov
Trendsharks
Plamen started his career on the global capital markets in 2012 when he began trading with financial derivatives.


