EUR/USD: quietly waiting for the next catalyst

EUR/USD Current price: 1.0777
View Live Chart for the EUR/USD
The EUR/USD pair remains contained by selling interest around 1.0820, but within its latest range, having quickly reverted a slide to 1.0767. Germany released its GFK Consumer confidence survey, showing that sentiment deteriorated in the country, as it came in at 9.8 from previous and expected 10.0. The ECB's targeted longer-term refinancing operation that took place this morning showed that banks took 233.5 billion euros for four-year loans, far above expected. Ahead of Wall Street's opening, Fed's Yellen is giving the opening remarks at the Federal Reserve System Community Development Research Conference, while in the US, weekly unemployment claims rose to their highest in seven weeks, up to 258K from previous 243K.
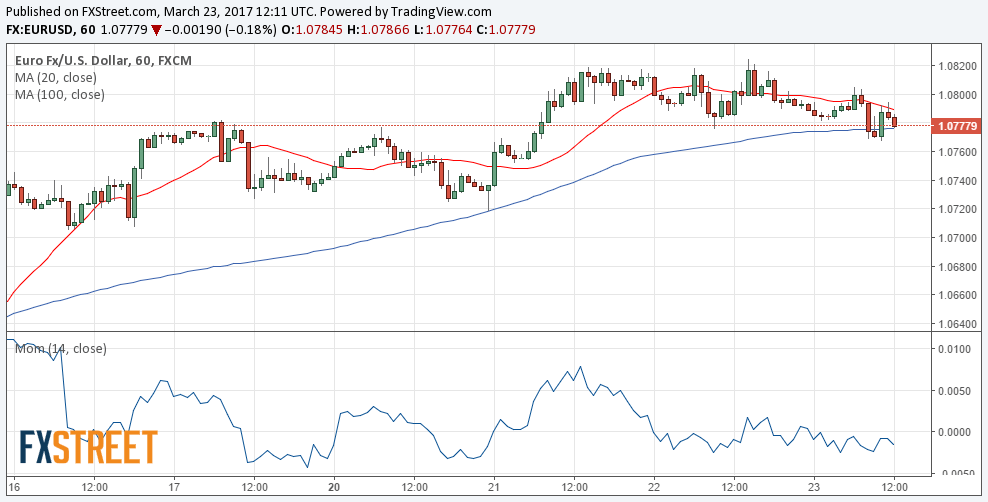
The pair presents a modest bearish tone in the short term, as in the 1 hour chart, the price is below a bearish 20 SMA, whilst technical indicators have remained within negative territory, now retreating from their mid-lines. In the 4 hours chart, the price is extending below a still bullish 20 SMA, whilst technical indicators have turned south, currently pressuring their mid-lines, and in line with the shorter term perspective. The pair however, needs to accelerate below 1.0760 to extend its intraday decline, with scope to test the 1.0690/1.0710 region.
Support levels: 1.0770 1.0735 1.0700
Resistance levels: 1.0820 1.0860 1.0900
GBP/USD Current price: 1.2496
View Live Chart for the GBP/USD
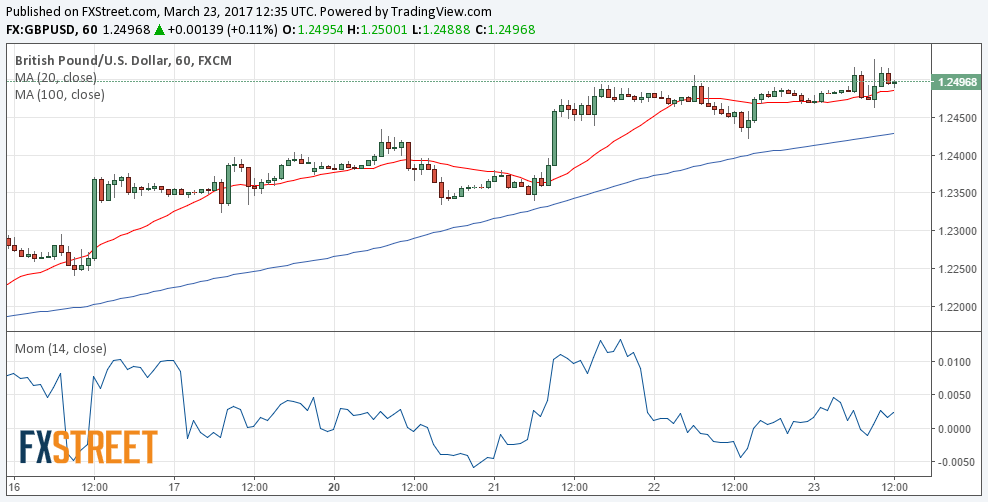
The GBP/USD pair advanced to a fresh 1-month high of 1.2527 following the release of much better-than-expected Retail Sales data in the UK. In February, retail sales increased by 3.7% compared with February 2016 and increased by 1.4% compared with January. The pair however, was unable to hold on to gains above 1.2500, and retreated to consolidate below the level. From a technical point of view, the risk remains towards the upside, as in the 1 hour chart, the price remains above its 20 SMA, whilst technical indicators have bounced from their mid-lines albeit with limited upward momentum as they remain below previous highs. In the 4 hours chart, the bullish tone remains intact as the price holds above a sharply bullish 20 SMA, whilst technical indicators maintain modest bullish slopes near overbought readings. Nevertheless, the pair needs to advance beyond 1.2540, a major Fibonacci resistance, to be able to extend its rally today.
Support levels: 1.2460 1.2425 1.2380
Resistance levels: 1.2540 1.2580 1.2610
USD/JPY Current price: 110.87
View Live Chart for the USD/JPY
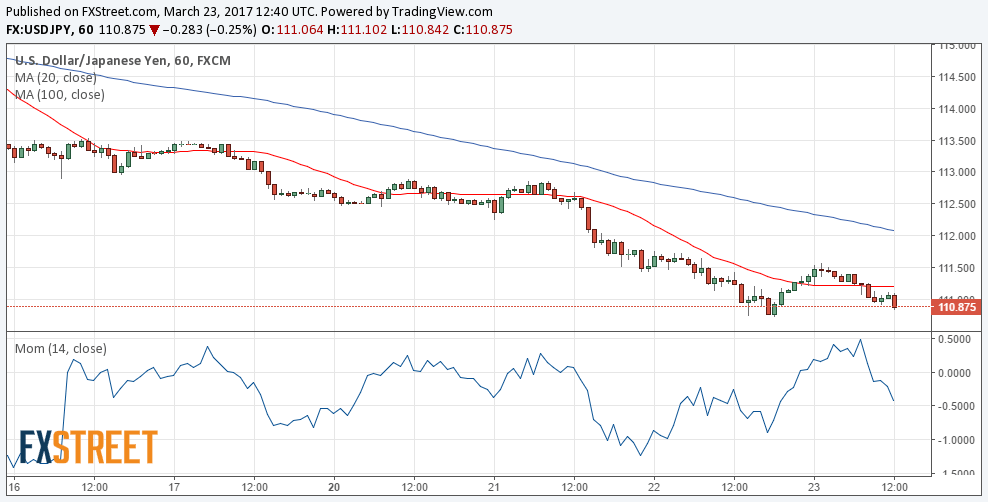
Bearish extension around the corner. The USD/JPY pair corrected higher early Asia, but met selling interest around 111.60, a former strong support, resuming its decline and now trading not far from the year low set this Wednesday at 110.72. Worse-than-expected US data, as weekly unemployment claims surprised to the upside, printing 258K against 240K expected for the week ended March 17th, fueled the pair's decline. Asian shares closed modestly higher, while in Europe, most equities trade in the green, although the pair keeps falling, indicating that traders have made up their minds and decided that is better to go long in the JPY, maintaining the risk towards the downside and exposing the 110.00 level. Short term, the 1 hour chart shows that the price is far below its moving averages, with the 100 SMA now approaching a major Fibonacci resistance at 112.00. Technical indicators in the mentioned time frame head strongly lower near oversold territory supporting some further slides. In the 4 hours chart, technical indicators accelerated their slides within oversold territory, reaffirming the shorter term outlook.
Support levels: 110.70 110.40 109.90
Resistance levels: 111.10 111.60 112.00
Author

Valeria Bednarik
FXStreet
Valeria Bednarik was born and lives in Buenos Aires, Argentina. Her passion for math and numbers pushed her into studying economics in her younger years.


