EUR/USD Price Forecast: Tepid buying on intraday dips

EUR/USD Current price: 1.1370
- European Central Bank officials giving mixed signals on future monetary policy.
- US CB Consumer Confidence likely to have remained depressed in April.
- EUR/USD finding near-term buyers on dips, retest of 1.1420 likely.
The EUR/USD pair hovers around 1.1370, easing from its Monday’s peak at 1.1420, but far from turning bearish. The US Dollar (USD) trades mixed across the FX board, but generally speaking, retains its broad weakness amid concerns related to tariffs.
United States (US) President Donald Trump levies and the tax bill maintain the market sentiment depressed, despite some positive headlines coming through, hardly enough to offset fears of higher inflation and a widening fiscal deficit.
Meanwhile, European Central Bank (ECB) officials spoke about monetary policy options. On the one hand, Francois Villeroy de Galhau, head of the Bank of France, said that the normalisation of interest rates in the euro zone is probably not complete, and “we are likely to see this at our governing council next week,” hinting at an upcoming rate cut.
On the other hand, ECB's Robert Holzmann called for a rate cut pause until September, adding policymakers “should keep powder dry given the US-EU trade war.” He also said that further rate cuts would likely have no effect on economic activity.
Other than that, the Eurozone (EU) released the May Economic Sentiment Indicator, which improved to 94.8 from the previous 93.6. The US published April Durable Goods Orders, which fell by 6.3% sharply down from the 7.6% advance posted in March, although better than the -7.9% decline anticipated by market players. The country will later release CB Consumer Confidence, foreseen at 87.1 in May, from the 86.0 posted in the previous month.
EUR/USD short-term technical outlook
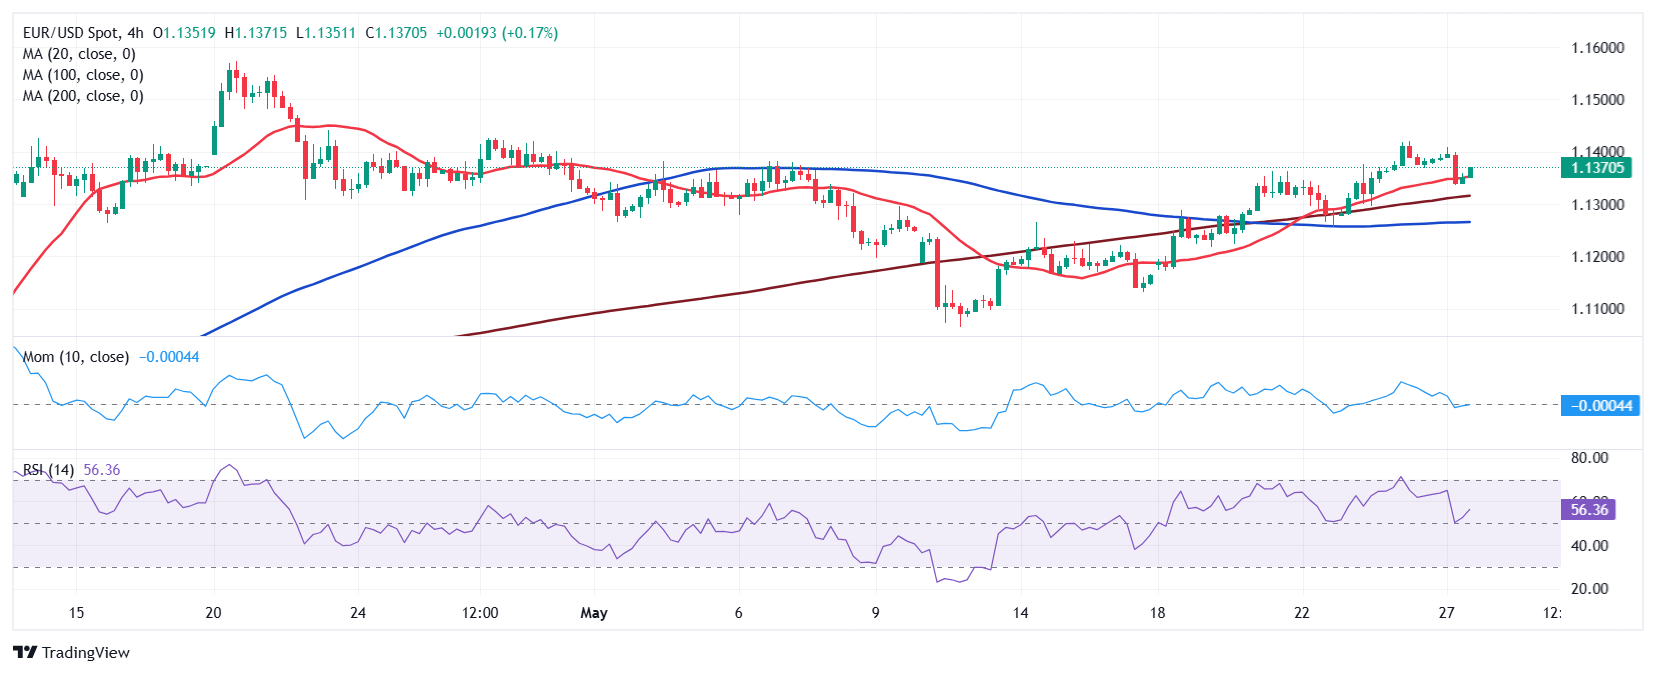
The daily chart for the EUR/USD pair shows it posted a lower high and a lower low, but also that it keeps developing far above a flat 20 Simple Moving Average (SMA), providing support at around 1.1270. Meanwhile, the 100 SMA extends its advance above the 200 SMA, far below the shorter one, usually understood as a sign of buyers' dominance. Finally, technical indicators lack directional strength while holding just above their midlines, failing to provide clear directional clues.
The near-term picture favours the upside. In the 4-hour chart, EUR/USD is finding buyers around a mildly bullish 20 SMA, which remains above the longer ones. Technical indicators, in the meantime, completed their retracement within positive levels, turning neutral-to-bullish right above their midlines, suggesting bulls are still willing to take their chances on intraday dips.
Support levels: 1.1330 1.1270 1.1240
Resistance levels: 1.1420 1.1460 1.1505
Premium
You have reached your limit of 3 free articles for this month.
Start your subscription and get access to all our original articles.
Author

Valeria Bednarik
FXStreet
Valeria Bednarik was born and lives in Buenos Aires, Argentina. Her passion for math and numbers pushed her into studying economics in her younger years.


