EUR/USD Price Forecast: Tepid buying amid fresh risk aversion

EUR/USD Current price: 1.0796
- US President Donald Trump threatened more tariffs, fears returned.
- The United States Q4 Gross Domestic Product was upwardly revised to 2.4%.
- EUR/USD recovers, bullish potential remains limited in the near term.
The US Dollar (USD) turned south on Thursday, helping EUR/USD recover from a multi-week low of 1.0733. The pair, however, is meeting near-term sellers around the 1.0800 mark.
Still, the USD is out of investors’ radar amid fresh United States (US) President Donald Trump's tariffs threats. Trump announced new import taxes of 25% on cars and car parts coming into the US late on Wednesday, while adding that more levies could be imposed on the Eurozone (EU) and Canada. Taxes on vehicles will come into effect on April 3, while those on parts will come into effect in May or later.
Concerns about the impact of fresh taxes undermined the market’s mood. Asian shares closed mixed, although most European indexes trade in the red, weighing on Wall Street. At the same time, government bond yields advance, with the yield curve shrinking, which is usually seen as a sign of an upcoming recession.
Data-wise, the EU had nothing relevant to offer. The US, on the contrary, released the final estimate of the Q4 Gross Domestic Product, which showed the economy grew at an annualized pace of 2.4%, revised from the previous 2.3% estimate. Initial Jobless Claims, in the meantime, increased by 224K, better than the 225K anticipated. Finally, February Wholesale Inventories stood at 0.3%, easing from the previous 0.8% and better than the 0.4% expected.
Later in the day, the US will publish February Pending Home Sales and the March Kansas Fed Manufacturing Activity index.
EUR/USD short-term technical outlook
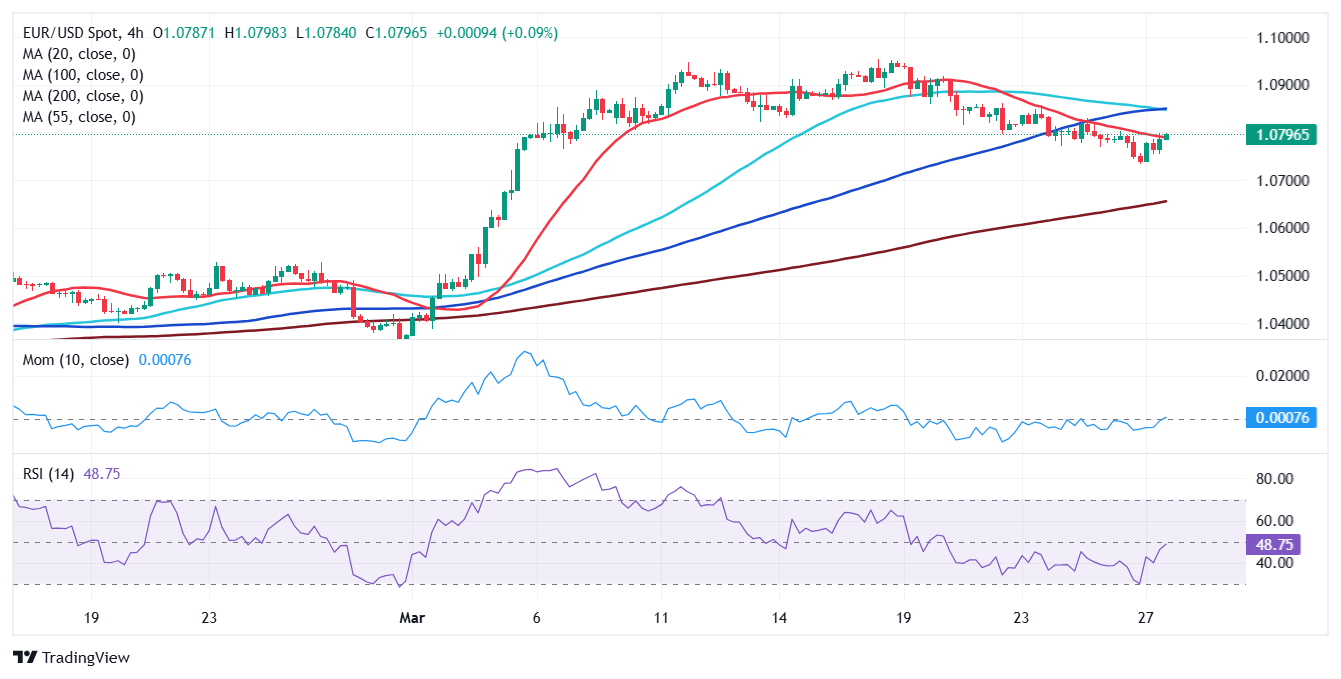
The EUR/USD pair pressures its intraday high at 1.0799, and the daily chart shows the pair found buyers for a second consecutive day at around a directionless 200 Simple Moving Average (SMA), providing dynamic support at around 1.0730. At the same time, the pair is aiming to surpass a still bullish 20 SMA, while the 100 SMA remains directionless far below the current level. The Momentum indicator turned flat right below its 100 line, offering a neutral reading, while the Relative Strength Index (RSI) indicator picked up, and heads north at around 56, skewing the risk to the upside without confirming additional gains.
The near-term picture suggests bulls remain cautious. Technical indicators in the 4-hour chart advance, but are still below their midlines. At the same time, the EUR/USD pair is battling a bearish 20 SMA, while the 100 SMA loses upward strength in the 1.0840 price zone. Bulls can return if the pair surpasses the latter.
Support levels: 1.0730 1.0690 1.0650
Resistance levels: 10840 1.0885 1.0925
Author

Valeria Bednarik
FXStreet
Valeria Bednarik was born and lives in Buenos Aires, Argentina. Her passion for math and numbers pushed her into studying economics in her younger years.


