EUR/USD Price Forecast: Corrective slide, additional declines unlikely

EUR/USD Current price: 1.1654
- US President Donald Trump threatens more and more tariffs left and right.
- German data failed to impress, limiting the Euro’s bullish potential.
- EUR/USD corrects lower in the near term, with additional slides once below 1.1630.
The EUR/USD pair extended its weekly advance to 1.1698, retreating from the level ahead of Wall Street’s opening. The US Dollar (USD) fell throughout the first half of the day amid United States (US) President Donald Trump threatening fresh tariffs left and right.
Trump said that he could impose an extra 25% tariff on Chinese goods over China's purchases of Russian oil, also threatening additional 15% levies on Japanese imports. Finally, he said he will impose a 100% tariff on semiconductors and chips, but not for companies that are building in the US.
President Trump and Tim Cook, Apple’s chief executive, announced on Wednesday that Apple would invest an additional $100 billion in the US and avoid Trump’s threat of tariffs.
On the data front, Germany published July Industrial Production, which fell by 1.9% in the month, worse than the 0.5% decline anticipated. The country also reported that the Trade Balance posted a €14.9 billion trade surplus in June, missing the expected €17.3 billion.
As for the US, the country released Initial Jobless Claims for the week ended August 2, which rose by 226K, worse than the previous revised 219K and the expected 221K.
Additionally, the US reported that Nonfarm Productivity in Q2 was up by 2.4%, missing the expected 2.5%, while Unit Labor Costs in the same period rose by 1.6%, higher than the 1.5% expected yet below the 6.9% posted in Q1, according to preliminary estimates. June Wholesale Inventories, Consumer Credit for the same month and Fed speakers are coming up next.
EUR/USD short-term technical outlook
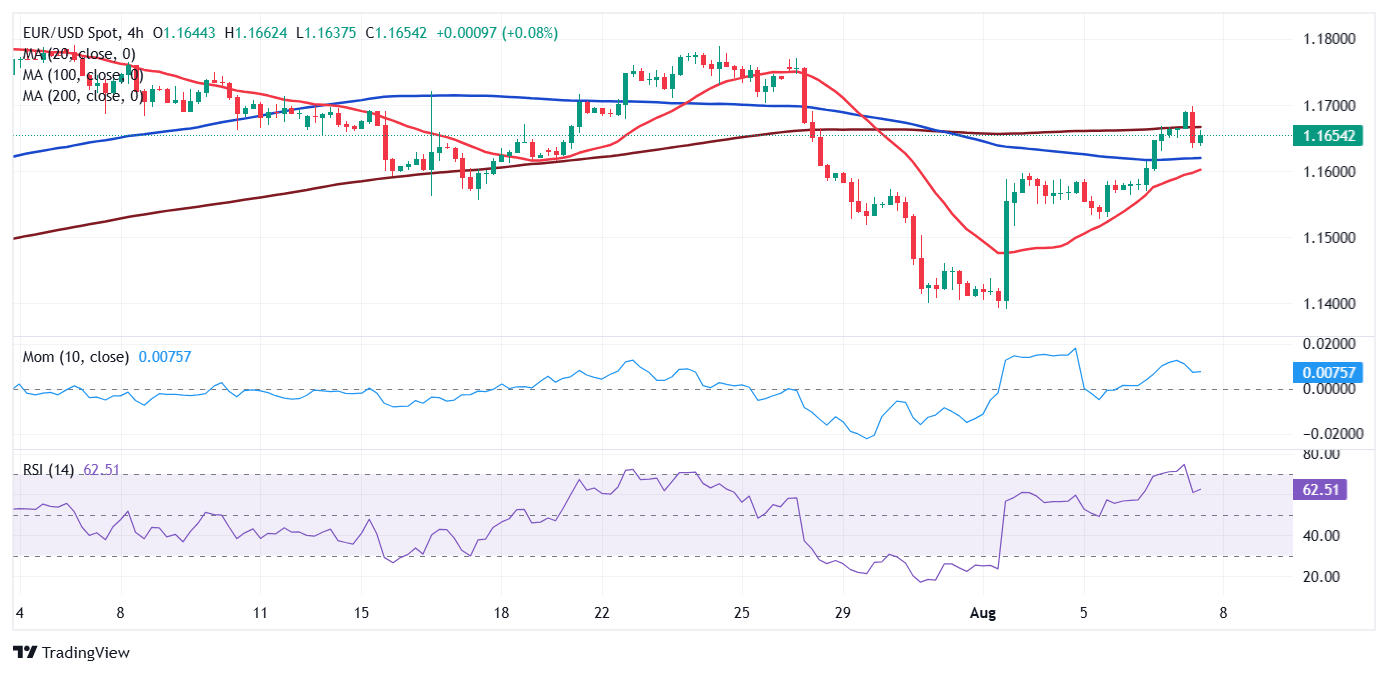
The EUR/USD pair hovers around 1.1650, pretty much unchanged from its daily opening. From a technical point of view, the pair retains its neutral-to-bullish stance. In the daily chart, EUR/USD posted a higher high and a higher low, while a flat 20 Simple Moving Average (SMA) provides support at around 1.1630. At the same time, technical indicators turned flat right above their midlines, offering no clear directional clues.
In the near term, and according to the 4-hour chart, EUR/USD is in a corrective decline that may continue if the 1.1630 level gives up. The pair crossed below a directionless 200 SMA, but remains above the 20 and 100 SMAs, with the shorter one still heading north. Finally, technical indicators ease from their intraday peaks near overbought readings, but remain well above their midlines, not enough to confirm an upcoming slide.
Support levels: 1.1630 1.1600 1.1560
Resistance levels: 1.1695 1.1740 1.1745
Premium
You have reached your limit of 3 free articles for this month.
Start your subscription and get access to all our original articles.
Author

Valeria Bednarik
FXStreet
Valeria Bednarik was born and lives in Buenos Aires, Argentina. Her passion for math and numbers pushed her into studying economics in her younger years.


