EUR/USD levels to watch after jumping on trade wars – Confluence Detector
EUR/USD has leaped after the US and China accelerated their threats for new tariffs and as global stocks dropped. What level should we be watching on the world's most popular currency pair?
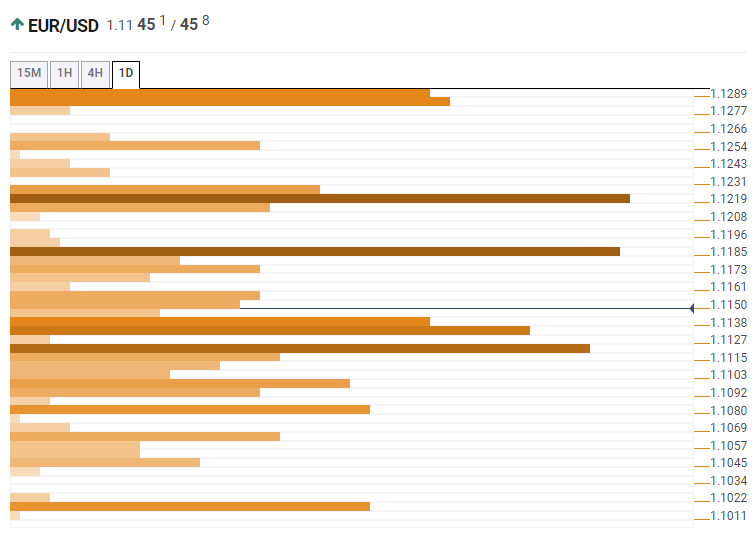
The Technical Confluences Indicator is showing that EUR/USD enjoys solid support around 1.1121, where we see the convergence of the Fibonacci 38.2% one-day, the Fibonacci 38.2% one-week, the Bollinger Band 1h-Middle, the Fibonacci 23.6% one-day, and the Fibonacci 23.6% one-week.
Further down, the next cushion awaits at 1.1080, where the Pivot Point one-day Support 1 and the PP 1w-S1 meet.
Looking up, resistance awaits at 1.1185, where we see the confluence of the Fibonacci 38.2% one-month, the PP 1d-R1, and the PP 1w-R1.
Further up, EUR/USD may target 1.1219, where we see the Simple Moving Average 100-one-day, and the previous yearly low converge.
Here is how it looks on the tool:
Confluence Detector
The Confluence Detector finds exciting opportunities using Technical Confluences. The TC is a tool to locate and point out those price levels where there is a congestion of indicators, moving averages, Fibonacci levels, Pivot Points, etc. Knowing where these congestion points are located is very useful for the trader, and can be used as a basis for different strategies.
This tool assigns a certain amount of “weight” to each indicator, and this “weight” can influence adjacents price levels. These weightings mean that one price level without any indicator or moving average but under the influence of two “strongly weighted” levels accumulate more resistance than their neighbors. In these cases, the tool signals resistance in apparently empty areas.
Author

Yohay Elam
FXStreet
Yohay is in Forex since 2008 when he founded Forex Crunch, a blog crafted in his free time that turned into a fully-fledged currency website later sold to Finixio.


