EUR/USD is locked in a tight range but the upside is slightly more appealing – Confluence Detector


EUR/USD tumbled down as the global mood soured. Yet after the big drops in stocks and oil, things look calmer now. What's next?.

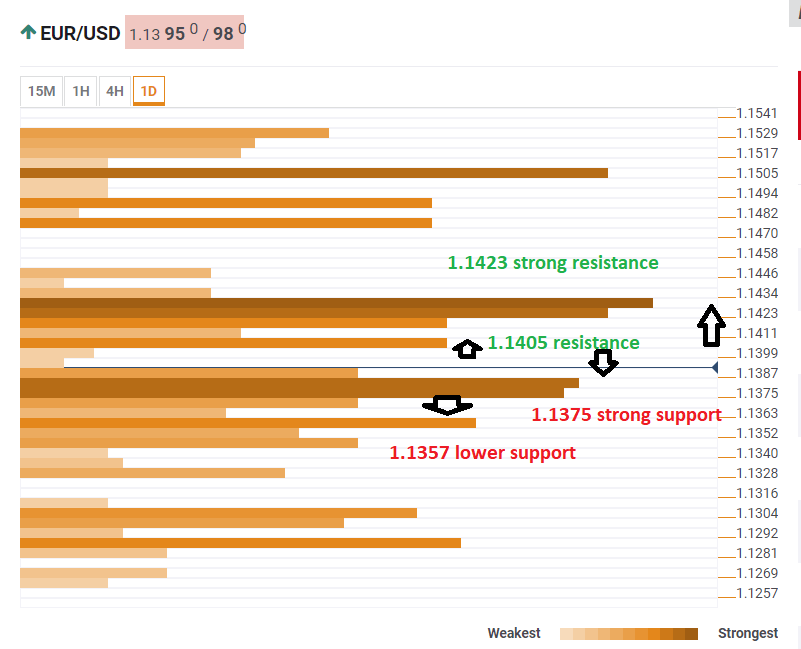
The Technical Confluences Indicator shows that the world's most popular currency pair faces some resistance around 1.1405 as this is the convergence of the Bollinger Band 4h-Middle and the Fibonacci 38.2% one-day.

Much more robust resistance awaits around 1.1423 where we see a dense cluster including the Simple Moving average 10-4h, the Fibonacci 38.2% one-month, the SMA 200-15m, the SMA 50-1h, last week's high, and the Bollinger Bands one-hour Upper. 

Support awaits at 1.1375 where we see the confluence of the Fibonacci 23.6% one-month, the SMA 5-1h, the Fibonacci 23.6% one-month, the SMA 10-1h, the Bollinger Band 15m-Lower, and the BB one-day Middle. 

The next support line is closer: 1.1357 is the meeting point of the SMA 10-one-day, the BB 1h-Lower, and the Fibonacci 38.2% one-week.

All in all, EUR/USD is surrounded by quite a few levels that should, in theory, keep it tight. However, a look at the chart shows that upside resistance is slightly weaker than downside support. 

Here is how it looks on the tool:

EUR USD technical confluence November 21 2018

Confluence Detector

The Confluence Detector finds exciting opportunities using Technical Confluences. The TC is a tool to locate and point out those price levels where there is a congestion of indicators, moving averages, Fibonacci levels, Pivot Points, etc. Knowing where these congestion points are located is very useful for the trader, and can be used as a basis for different strategies.

This tool assigns a certain amount of “weight” to each indicator, and this “weight” can influence adjacents price levels. These weightings mean that one price level without any indicator or moving average but under the influence of two “strongly weighted” levels accumulate more resistance than their neighbors. In these cases, the tool signals resistance in apparently empty areas.

Learn more about Technical Confluence

Information on these pages contains forward-looking statements that involve risks and uncertainties. Markets and instruments profiled on this page are for informational purposes only and should not in any way come across as a recommendation to buy or sell in these assets. You should do your own thorough research before making any investment decisions. FXStreet does not in any way guarantee that this information is free from mistakes, errors, or material misstatements. It also does not guarantee that this information is of a timely nature. Investing in Open Markets involves a great deal of risk, including the loss of all or a portion of your investment, as well as emotional distress. All risks, losses and costs associated with investing, including total loss of principal, are your responsibility. The views and opinions expressed in this article are those of the authors and do not necessarily reflect the official policy or position of FXStreet nor its advertisers. The author will not be held responsible for information that is found at the end of links posted on this page.

If not otherwise explicitly mentioned in the body of the article, at the time of writing, the author has no position in any stock mentioned in this article and no business relationship with any company mentioned. The author has not received compensation for writing this article, other than from FXStreet.

FXStreet and the author do not provide personalized recommendations. The author makes no representations as to the accuracy, completeness, or suitability of this information. FXStreet and the author will not be liable for any errors, omissions or any losses, injuries or damages arising from this information and its display or use. Errors and omissions excepted.

The author and FXStreet are not registered investment advisors and nothing in this article is intended to be investment advice.

Recommended Content


Recommended Content

Editors’ Picks

AUD/USD pressures as Fed officials hold firm on rate policy

AUD/USD pressures as Fed officials hold firm on rate policy

The Australian Dollar is on the defensive against the US Dollar, as Friday’s Asian session commences. On Thursday, the antipodean clocked losses of 0.21% against its counterpart, driven by Fed officials emphasizing they’re in no rush to ease policy. The AUD/USD trades around 0.6419.

AUD/USD News

EUR/USD extends its downside below 1.0650 on hawkish Fed remarks

EUR/USD extends its downside below 1.0650 on hawkish Fed remarks

The EUR/USD extends its downside around 1.0640 after retreating from weekly peaks of 1.0690 on Friday during the early Asian session. The hawkish comments from Federal Reserve officials provide some support to the US Dollar.

EUR/USD News

Gold price edges higher on risk-off mood hawkish Fed signals

Gold price edges higher on risk-off mood hawkish Fed signals

Gold prices advanced late in the North American session on Thursday, underpinned by heightened geopolitical risks involving Iran and Israel. Federal Reserve officials delivered hawkish messages, triggering a jump in US Treasury yields, which boosted the Greenback.

Gold News

Runes likely to have massive support after BRC-20 and Ordinals frenzy

Runes likely to have massive support after BRC-20 and Ordinals frenzy

With all eyes peeled on the halving, Bitcoin is the center of attention in the market. The pioneer cryptocurrency has had three narratives this year already, starting with the spot BTC exchange-traded funds, the recent all-time high of $73,777, and now the halving.

Read more

Billowing clouds of apprehension

Billowing clouds of apprehension

Thursday marked the fifth consecutive session of decline for US stocks as optimism regarding multiple interest rate cuts by the Federal Reserve waned. The downturn in sentiment can be attributed to robust economic data releases, prompting traders to adjust their expectations for multiple rate cuts this year.

Read more

Majors

Cryptocurrencies

Signatures