EUR/USD has visible signs to keep its current bullish trend
Harmonic Elliott Wave shows eurusd is somehow on wave -c- of primary wave (iii). by using H.E.R, nodes were found and price might touch the targets beacause of the capacitance of movement of the waves.
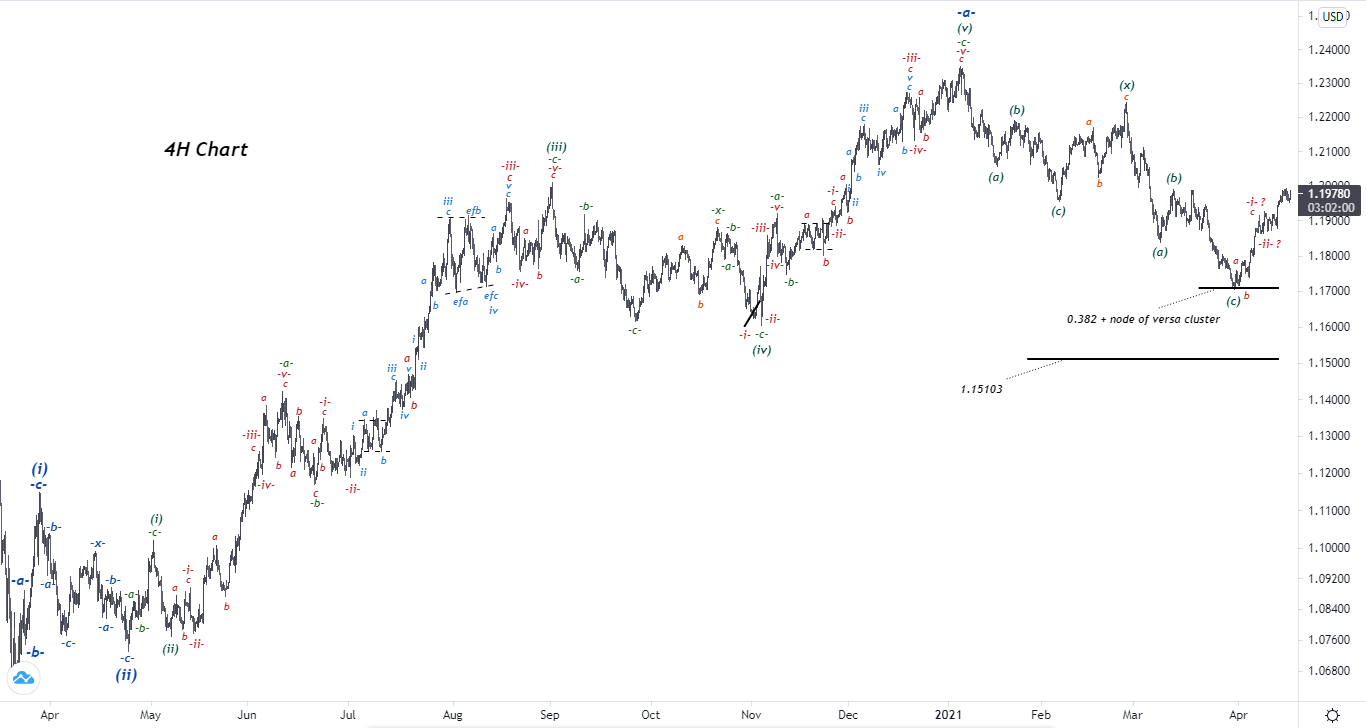
Daily outlook
In the 4-hours chart, we see the price completed wave -a- of wave (iii), the recent down-trend is wave -b- of wave (iii). i guess the wave -b- is completed by hitting a node of versa cluster and 0.382 Fibonacci ratio. and price might rebound to the previous high, where correction started. that's the minimum target for the mid-term.
Now let's take a look at 30 minutes chart.
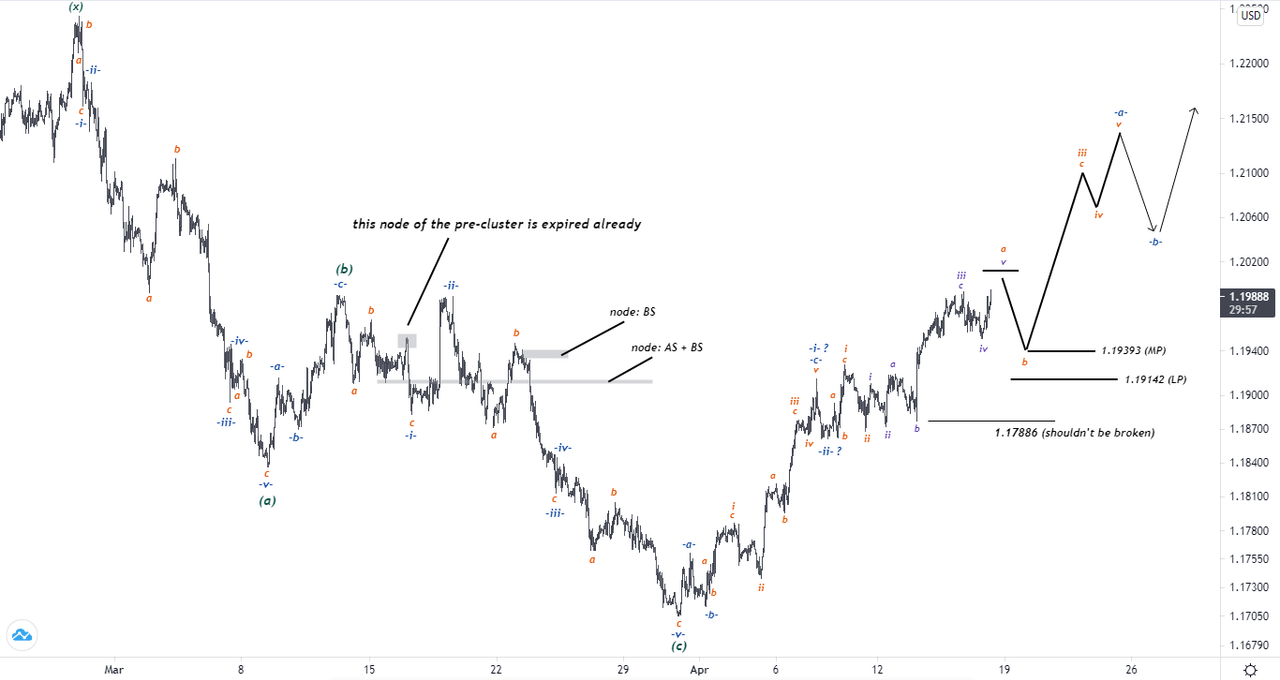
As you see, there's a chance for the price to complete wave -iii- and if the waves were counted correctly, i suppose wave c of wave -iii- can be longer.
By the way, i'm looking for the wave b of the last micro-wave to start and be completed on a valid level, due to having some strong node which are specified in the chart, price might move down to 1.19393 (MP) and 1.19142 (LP) then drift higher. according to the analysis, the price shouldn't break 1.17886 and in case of breaking the level, this analysis is failed and price might move down to 1.15103 mid-term.
Author

Elizabeth Nersesian
HarmonicEquilibriumRouting
Elizabeth Nersesian is a Russian/Iranian technical analyst and trader which started her early experience in 2014 in Forex Market.


