|

EUR/USD, GBP/USD Retracements Testing Fibonacci Support Levels

EUR/USD

4 hour

EURUSD

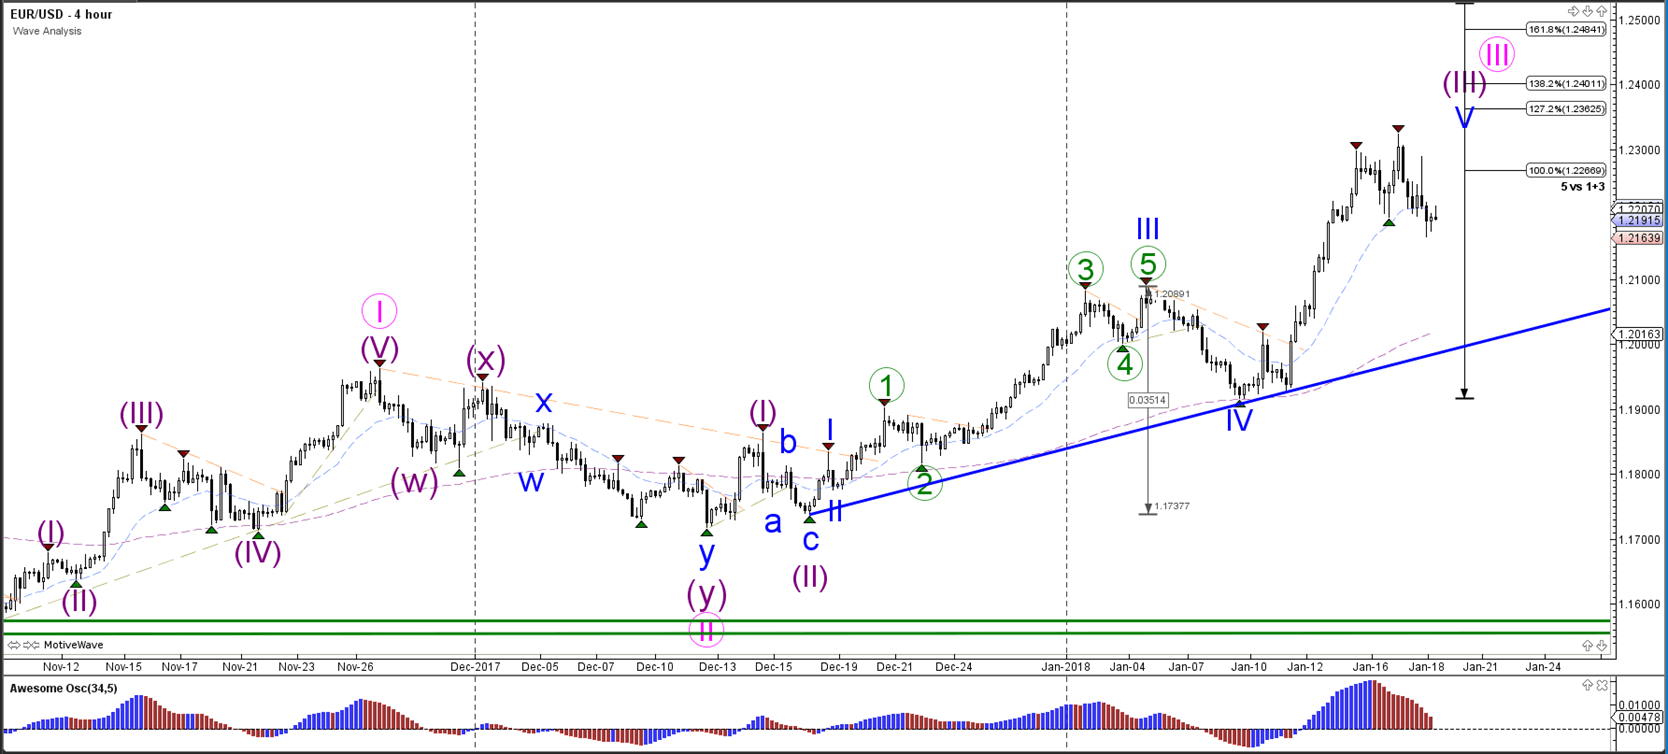
The EUR/USDis building a bearish retracement at the moment but price is most likely still part of a larger wave 3 (purple) unless price breaks the support trend lines and Fibonacci levels on the 1 chart.

1 hour

EURUSD

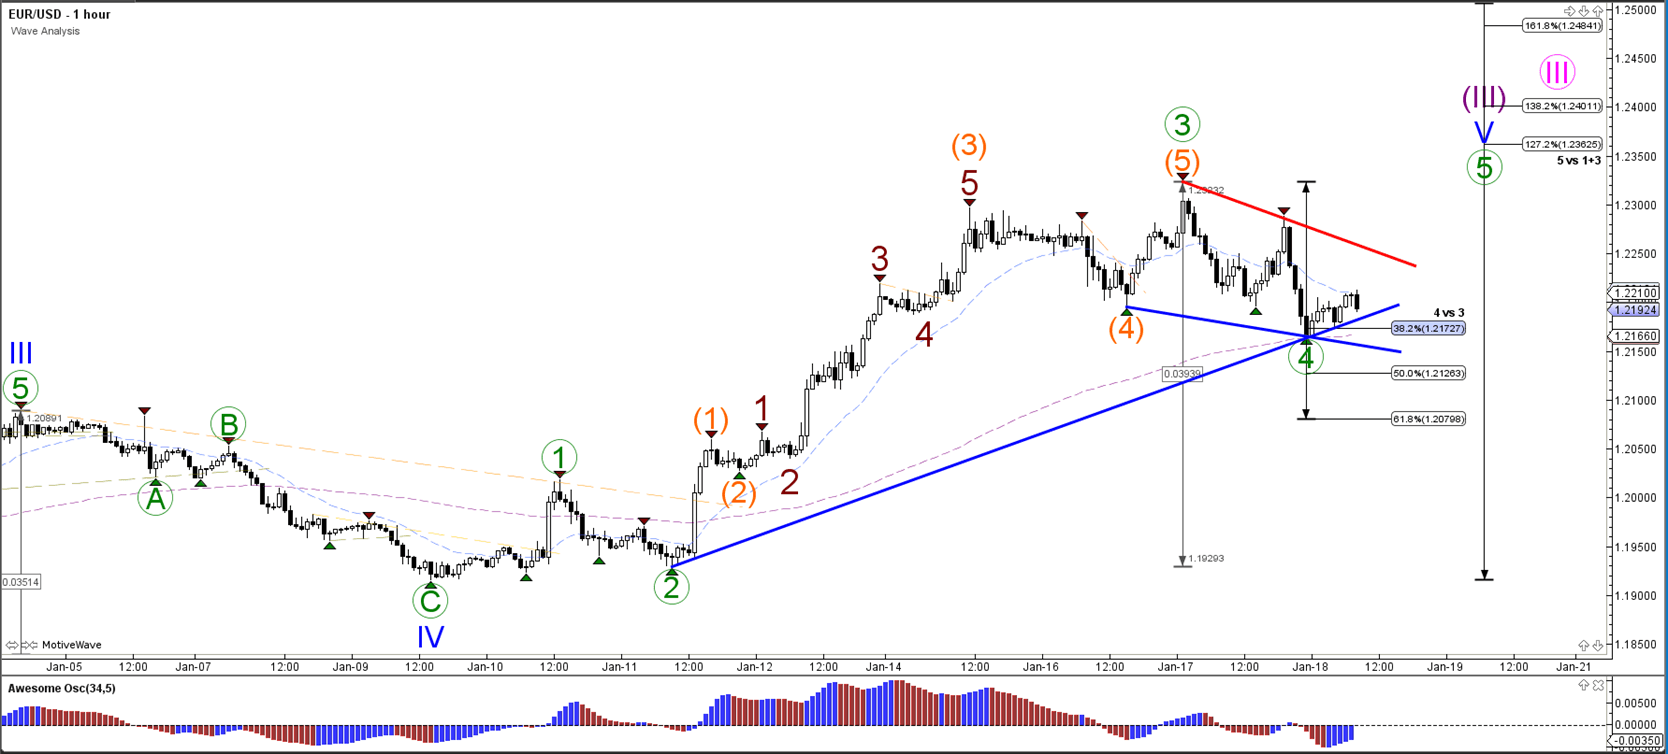
The EUR/USD is testing the support trend lines and Fibonacci levels of wave 4 (green). A bullish bounce and breakout above the resistance trend line (red) could spark a larger uptrend continuation towards the Fibonacci targets of wave 5. A bearish break could indicate that a different wave count is valid although the 50% Fibonacci level of wave 4 remains a strong zone.

GBP/USD

4 hour

GBPUSD

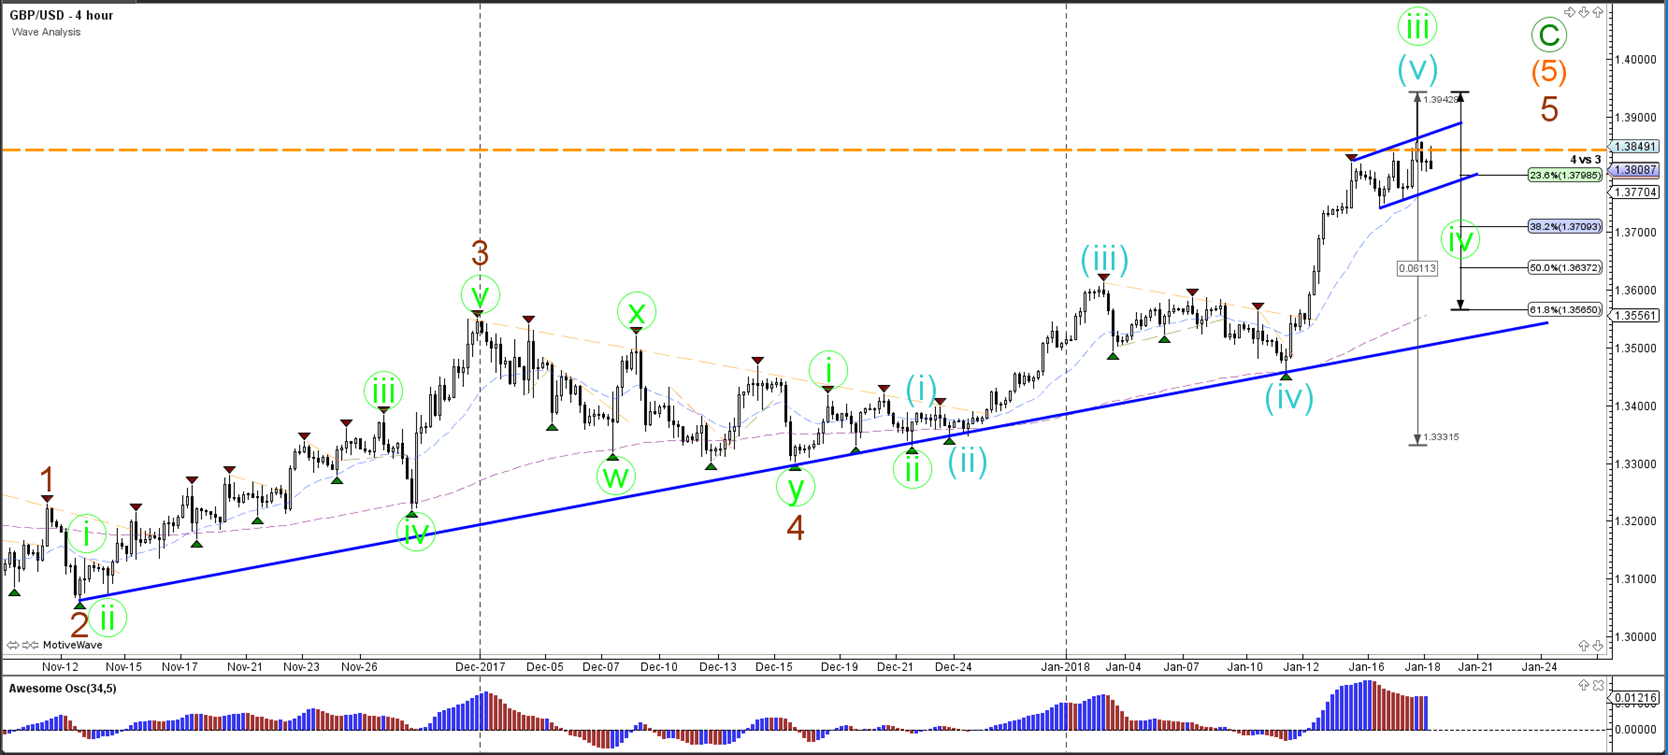
The GBP/USDbroke abovethe orange horizontal line which indicates the bottom of wave 1 on a weekly chart and indicates a new wave count for the long-term (see weekly wave analysis next Monday for the newest update).

1 hour

GBPUSD

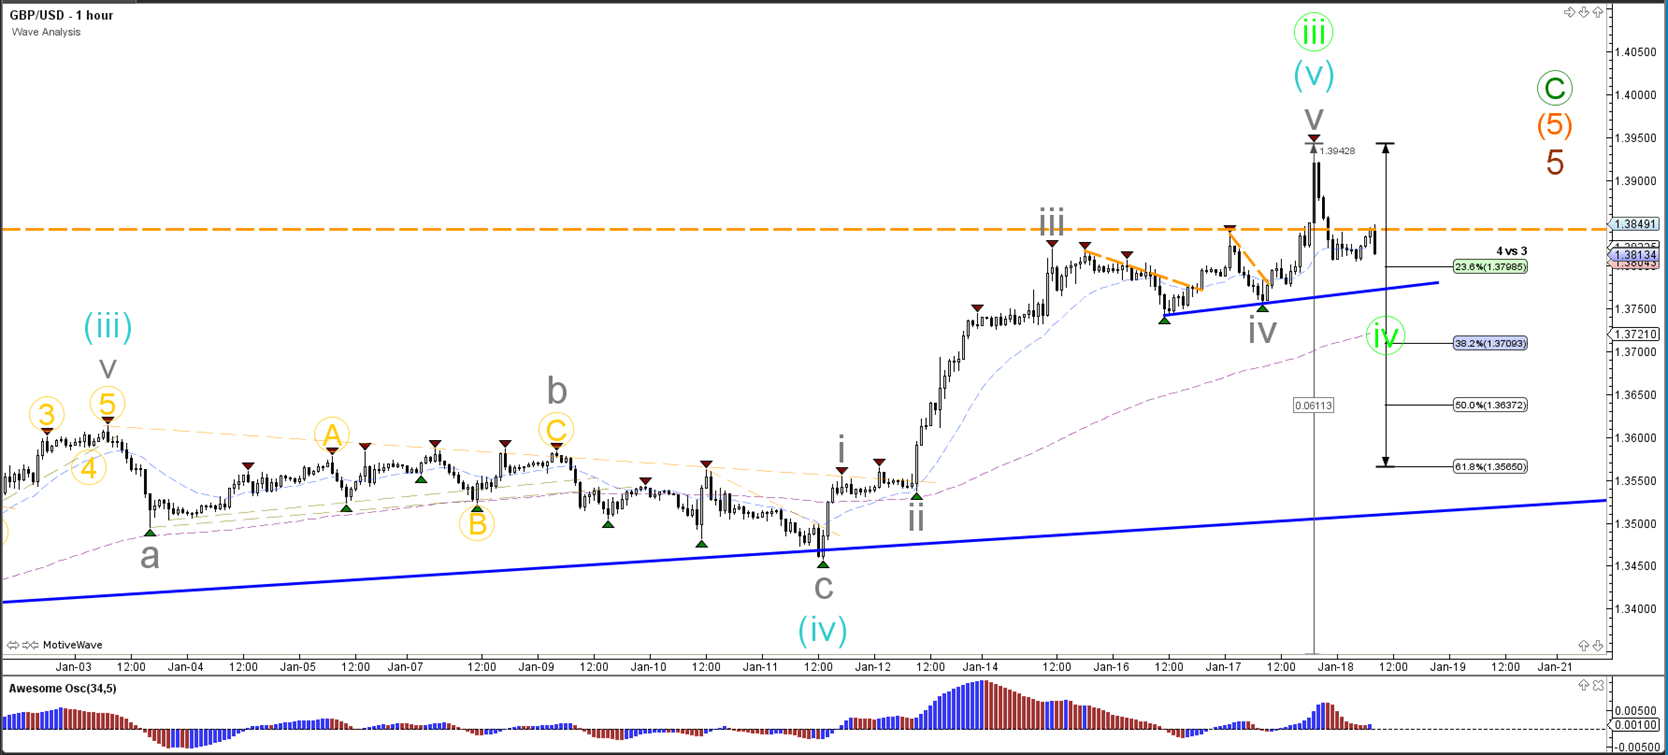
The GBP/USDprice action is looking strongly bearish at the moment but the Fibonacci levels of wave 4 (green) remain potential bouncing spots.

USD/JPY 

4 hour

USDJPY

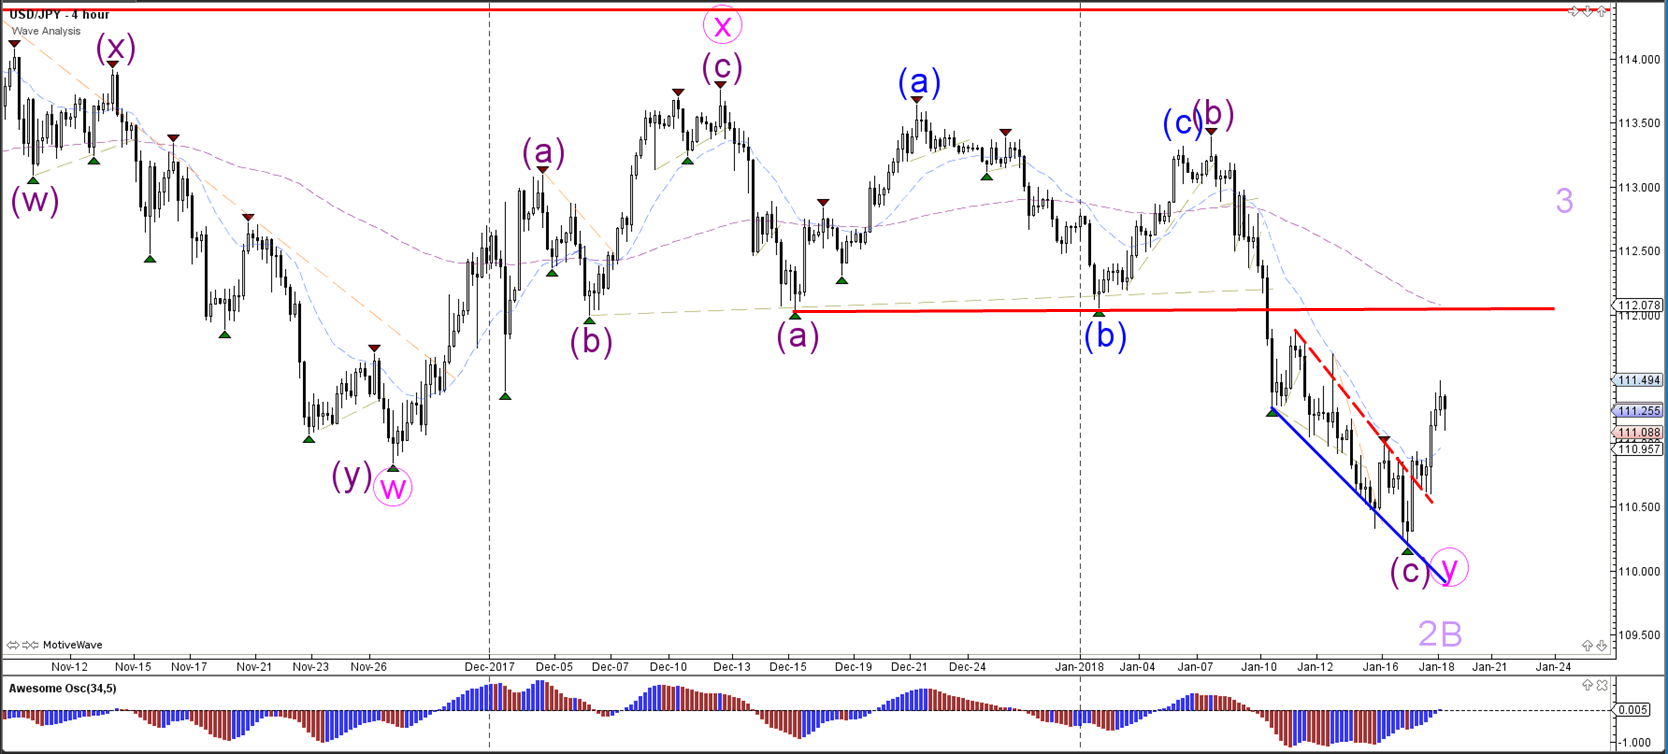
The USD/JPY is indeed breaking through the resistance trend line (dotted red) and resistance fractal with strong bullish candles. The bullish breakout could retest the broken bottom (red) and long-term moving average.

1 hour

USDJPY

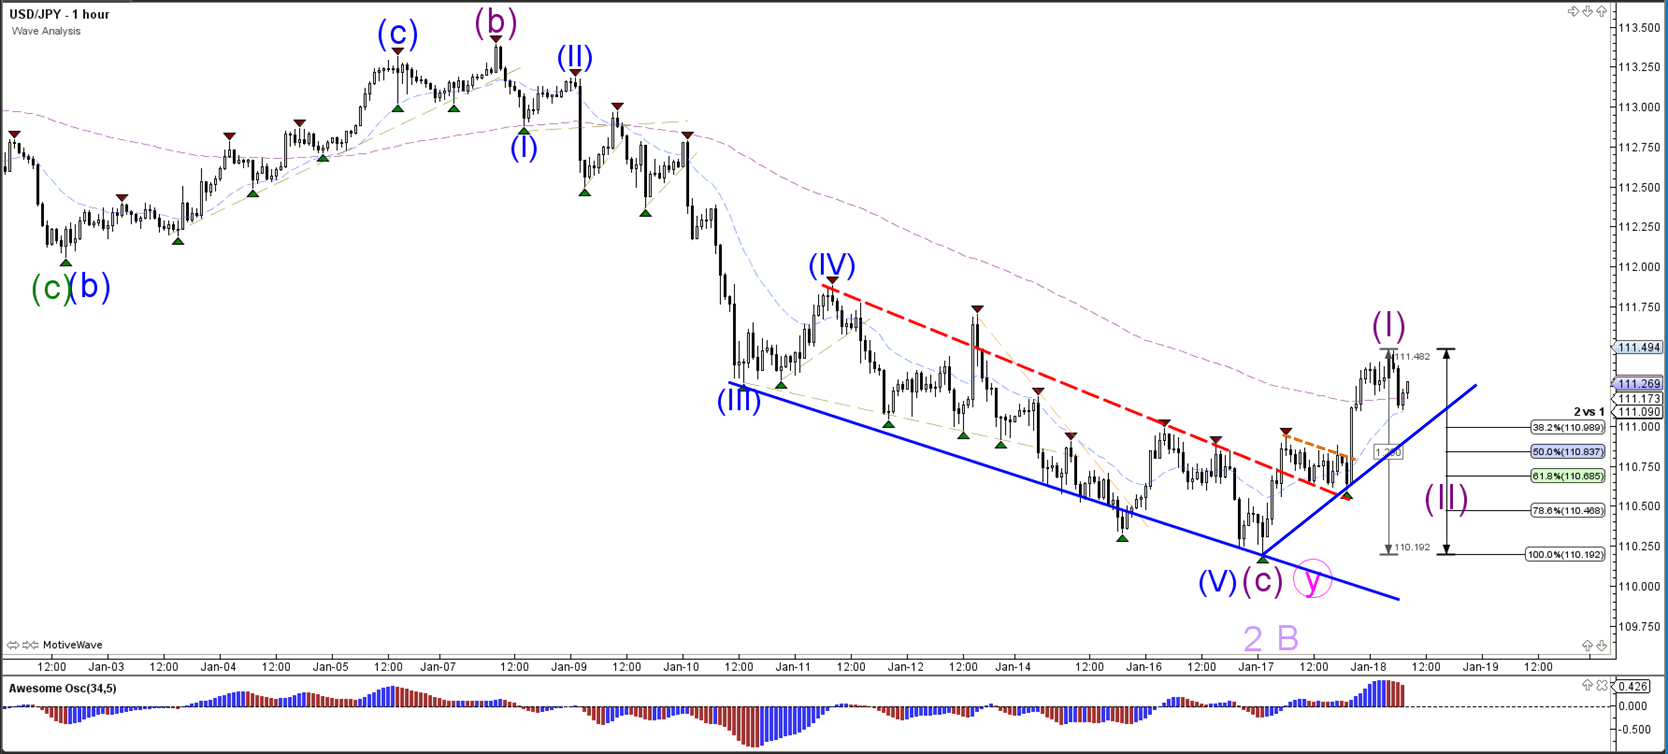
The USD/JPY is probably in a wave 1 (purple) at the moment. If price does make a bearish retracement by breaking below the support trend line (blue), then price will probably build a retracement within wave 2 (purple).

Author

Chris Svorcik

Chris Svorcik

Elite CurrenSea

Experience Chris Svorcik has co-founded Elite CurrenSea in 2014 together with Nenad Kerkez, aka Tarantula FX. Chris is a technical analyst, wave analyst, trader, writer, educator, webinar speaker, and seminar speaker of the financial markets.

More from Chris Svorcik
Share:

Editor's Picks

EUR/USD off highs, back to 1.1850

EUR/USD loses some upside momentum, returning to the 1.1850 region amid humble losses. The pair’s slight decline comes against the backdrop of a marginal advance in the US Dollar as investors continue to assess the latest US CPI readings.

GBP/USD advances to daily tops around 1.3650

GBP/USD now manages to pick up extra pace, clinching daily highs around 1.3650 and leaving behind three consecutive daily pullbacks on Friday. Cable’s improved sentiment comes on the back of the inconclusive price action of the Greenback, while recent hawkish comments from the BoE’s Pill also collaborates with the uptick.

Gold surpasses $5,000/oz, daily highs

Gold is reclaiming part of the ground lost on Wednesday’s marked decline, as bargain-hunters keep piling up and lifting prices past the key $5,000 per troy ounce. The yellow metal’s upside is also propped up by the lack of clear direction around the US Dollar post-US CPI release.

Crypto Today: Bitcoin, Ethereum, XRP in choppy price action, weighed down by falling institutional interest 

Bitcoin's upside remains largely constrained amid weak technicals and declining institutional interest. Ethereum trades sideways above $1,900 support with the upside capped below $2,000 amid ETF outflows.

Week ahead – Data blitz, Fed Minutes and RBNZ decision in the spotlight

US GDP and PCE inflation are main highlights, plus the Fed minutes. UK and Japan have busy calendars too with focus on CPI. Flash PMIs for February will also be doing the rounds. RBNZ meets, is unlikely to follow RBA’s hawkish path.

Ripple Price Forecast: XRP potential bottom could be in sight

Ripple edges up above the intraday low of $1.35 at the time of writing on Friday amid mixed price actions across the crypto market. The remittance token failed to hold support at $1.40 the previous day, reflecting risk-off sentiment amid a decline in retail and institutional sentiment.