EUR/USD, GBP/USD Build Triangle Chart Patterns in Uptrend
EUR/USD
4 hour
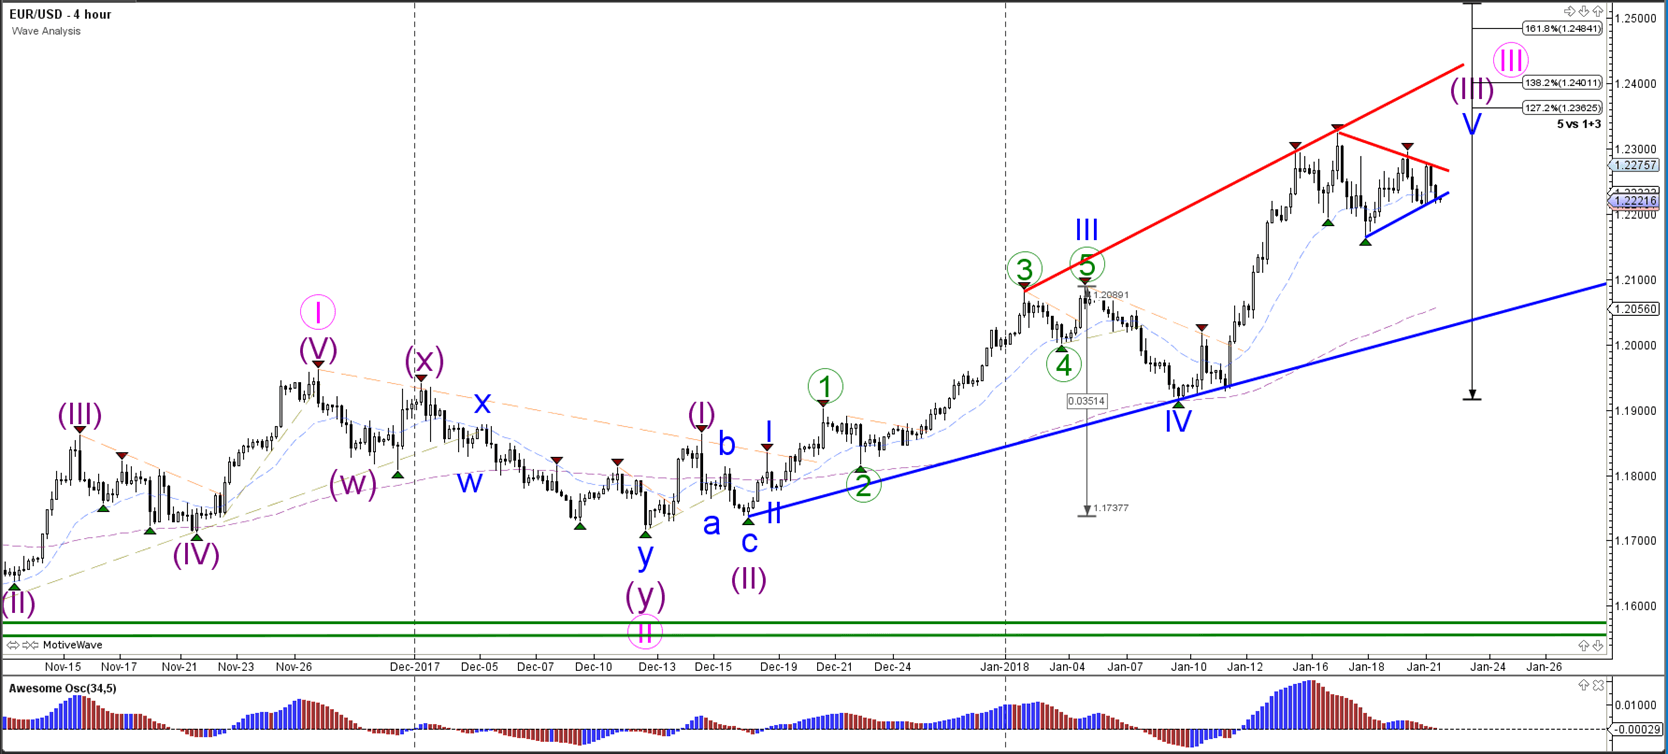
The EUR/USDis building a sideways retracement and the triangle chart pattern is probably just a correction within the uptrend.A bullish breakout above the resistance trend line (dotted red) could indicate the uptrend continuation towards the Fibonacci targets of wave 5 (blue).
1 hour
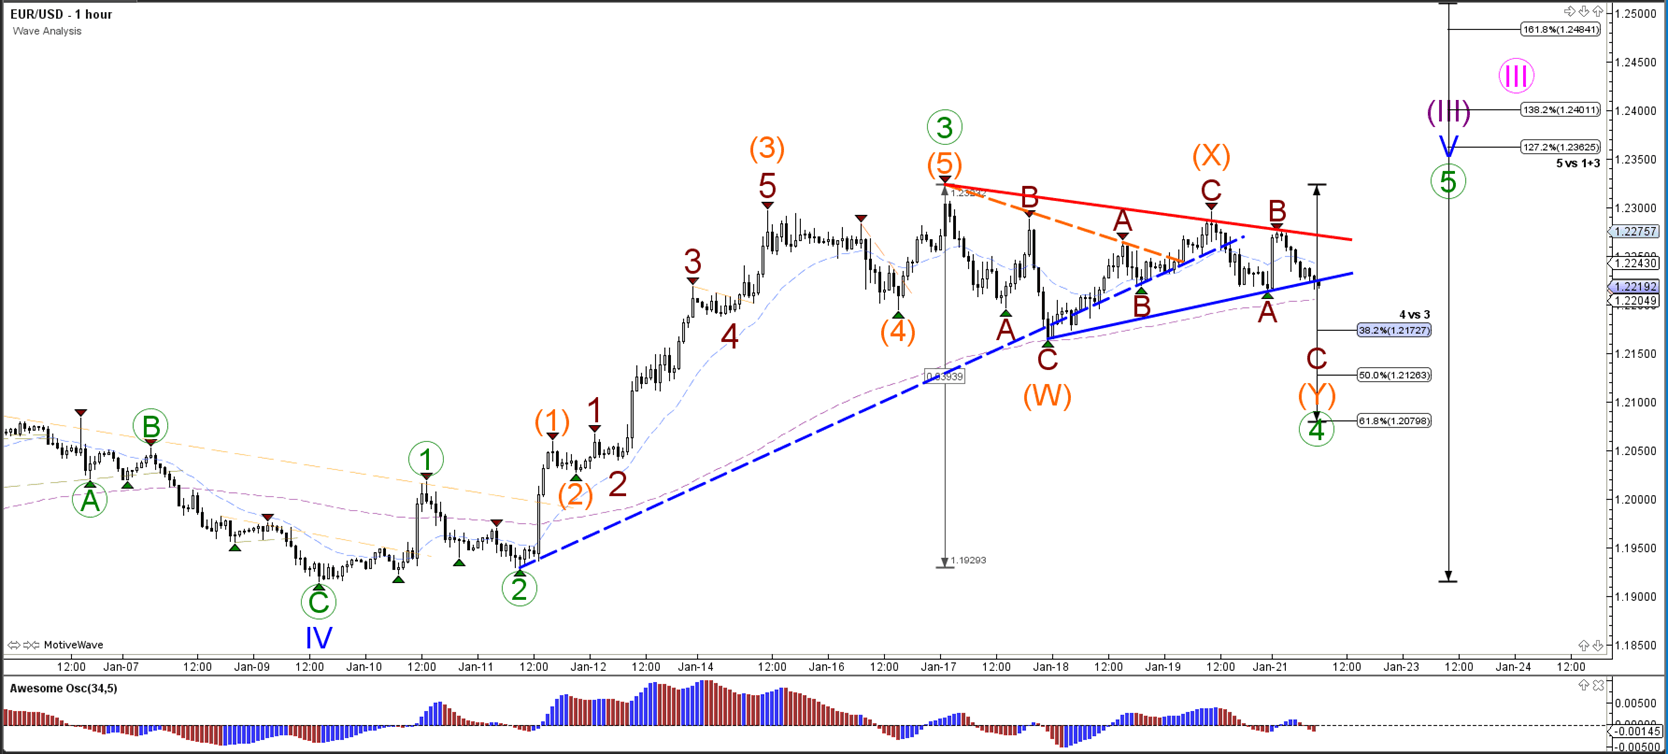
The EUR/USD could expand the correction via a bearish ABC (brown) zigzag if price breaks below the support trend line (blue).
GBP/USD
4 hour
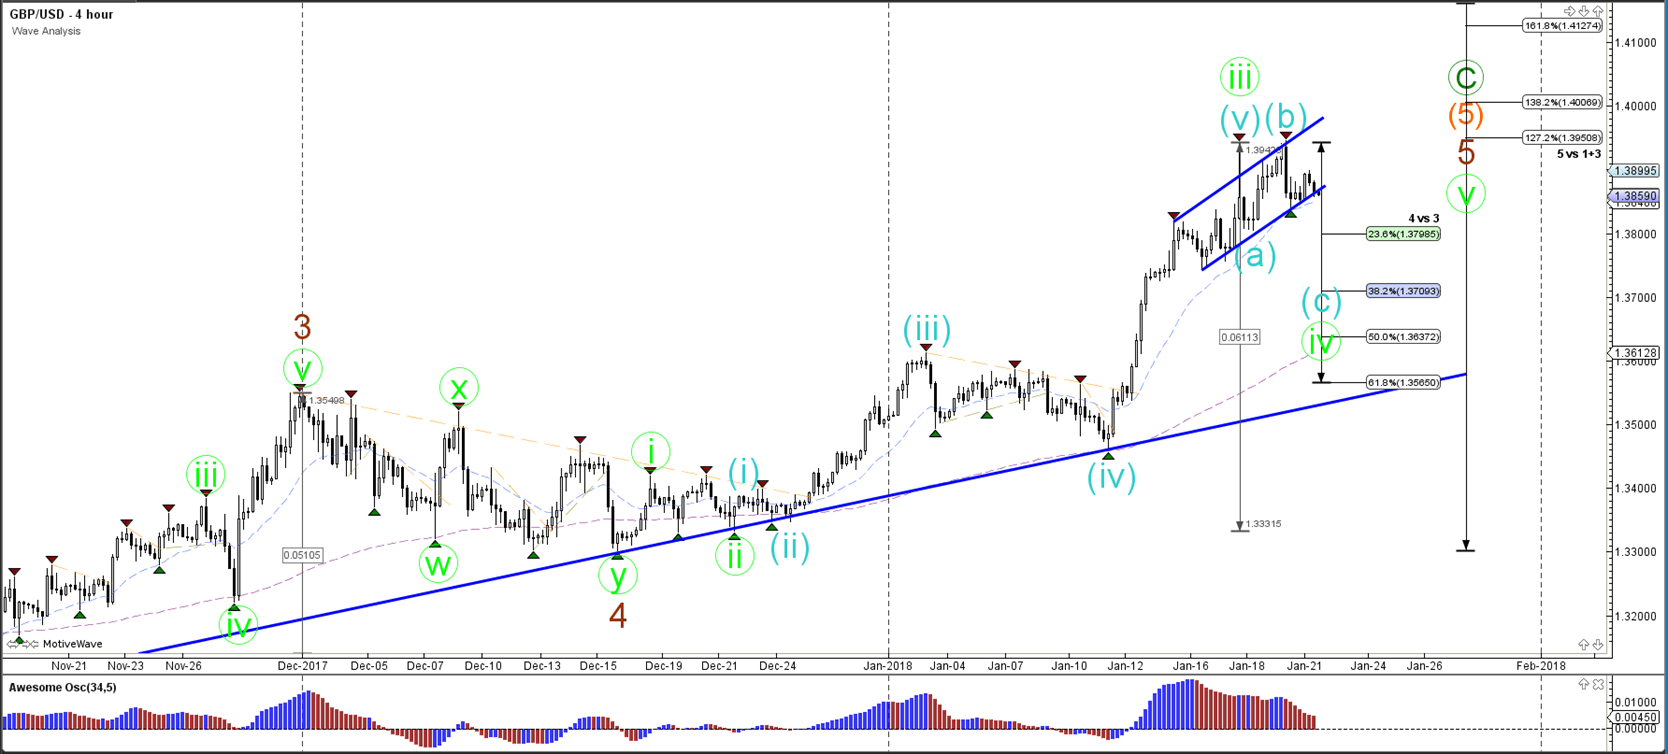
The GBP/USDis challenging the support line of the bullish channel. A break below the channel could see price test theFibonacci support levels of wave 4 (green).
1 hour
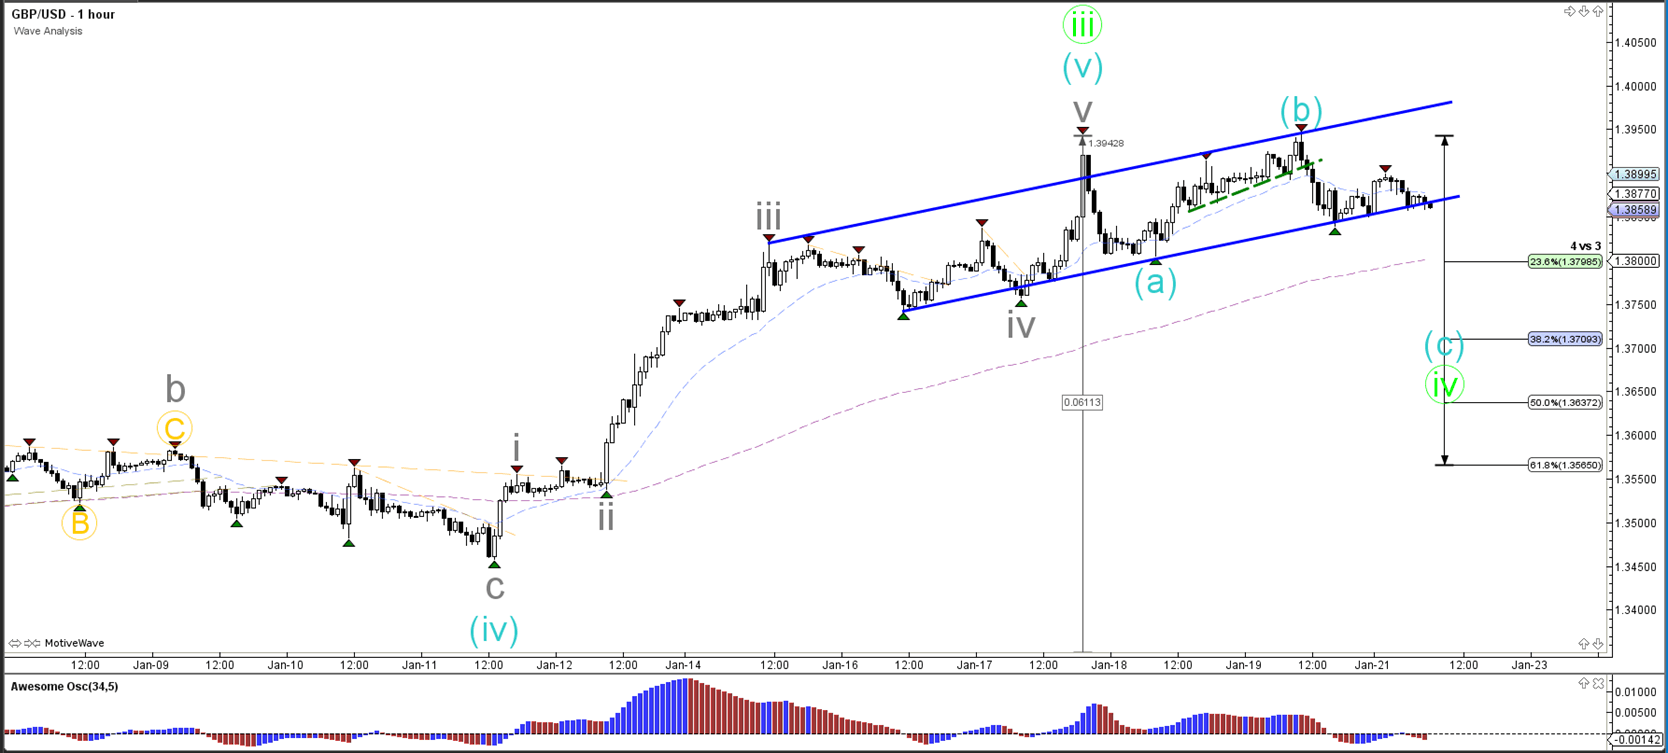
The GBP/USDis building a potential wave ABC (blue) correction which could take price towards the Fib levels. A bullish break above the round level of 1.40 could indicate acontinuation of the uptrend.
USD/JPY
4 hour
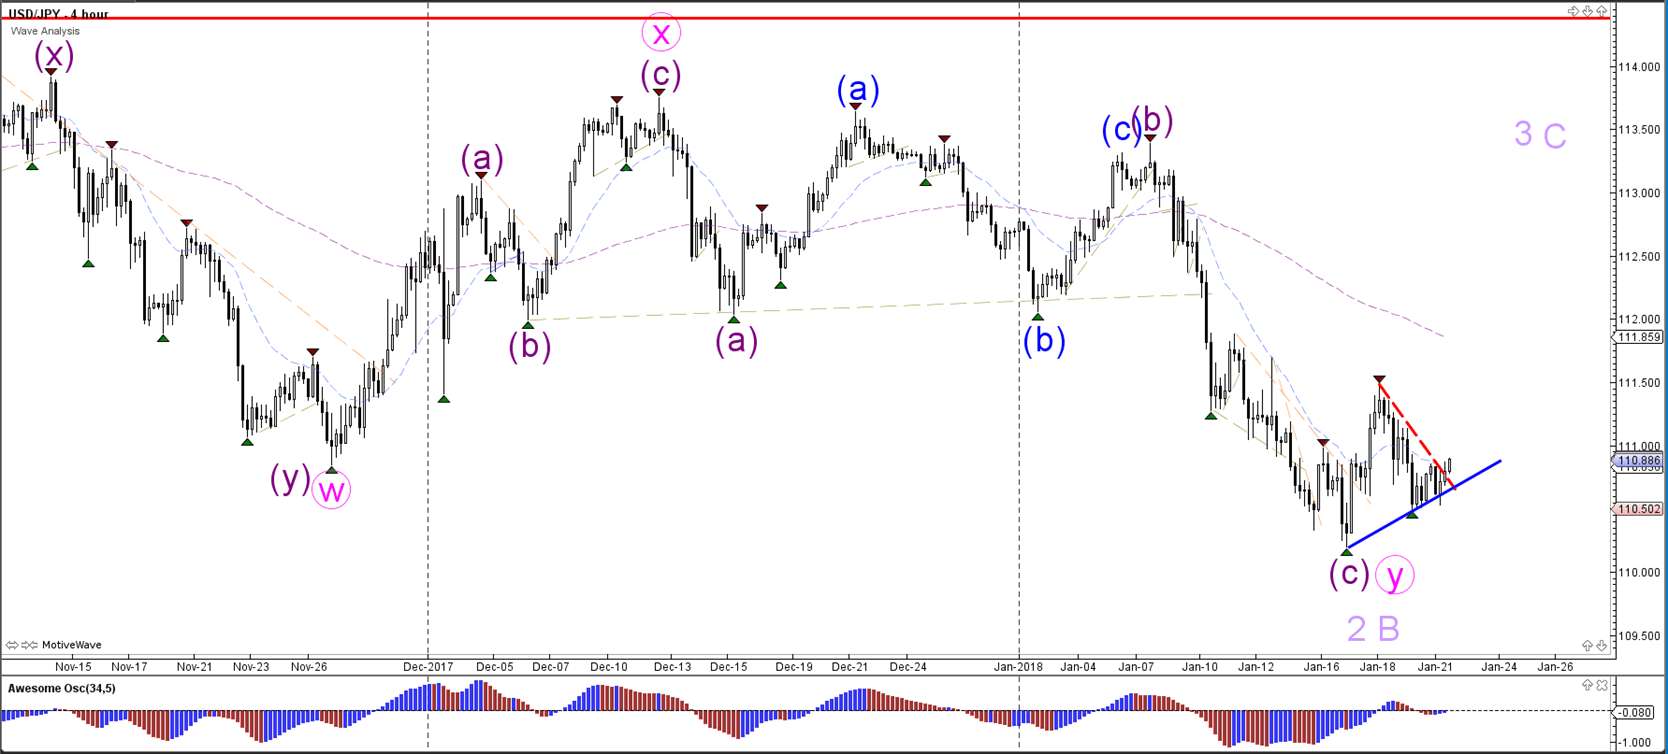
The USD/JPY failed to break the previous bottom and could be using it to bolster a new bullish rally.
1 hour
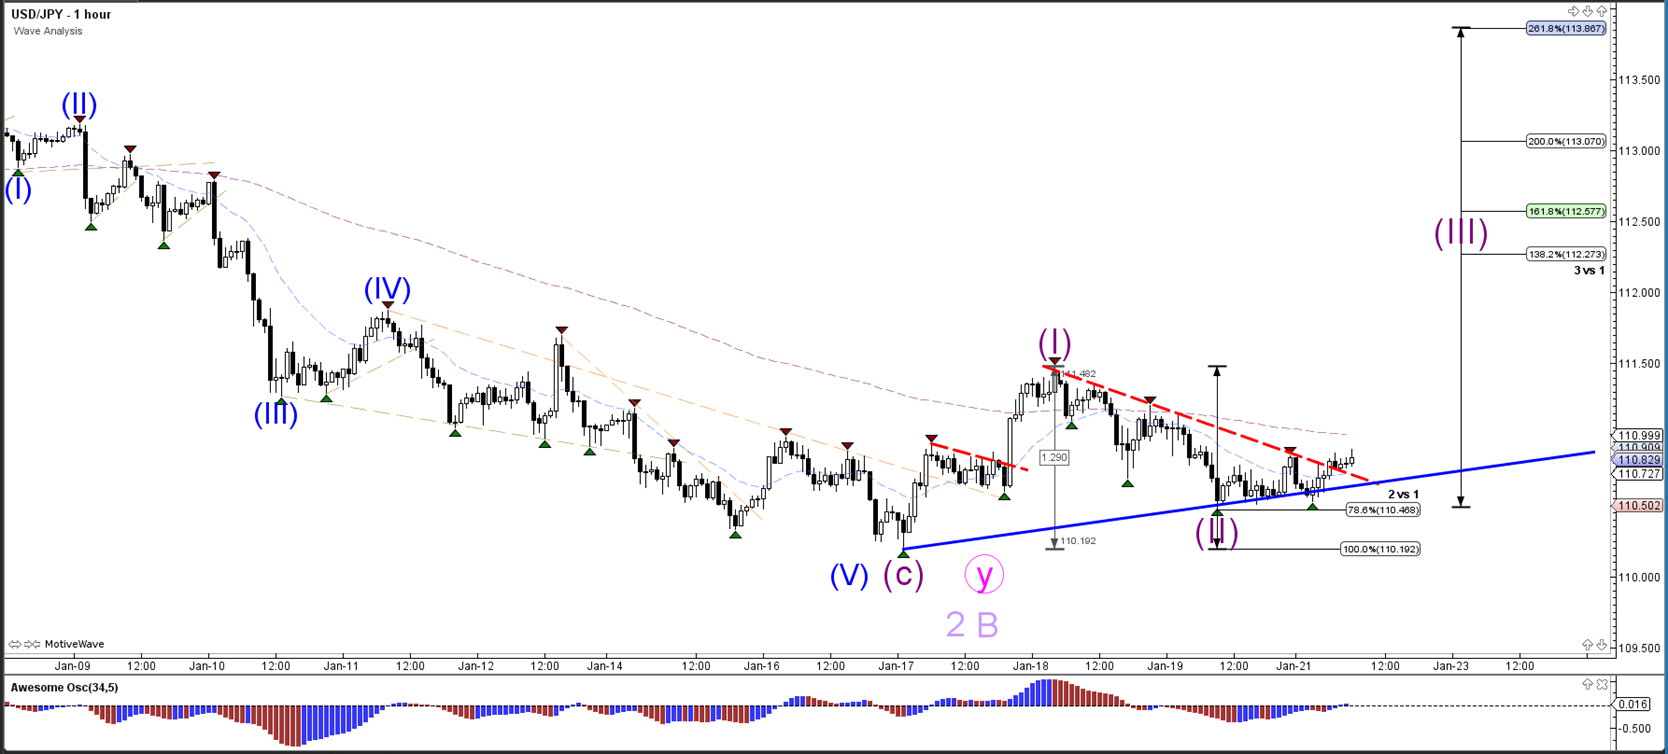
The USD/JPY could be completing wave 2 (purple) and starting a wave 3 (purple) bullish momentum.
Author

Chris Svorcik
Elite CurrenSea
Experience Chris Svorcik has co-founded Elite CurrenSea in 2014 together with Nenad Kerkez, aka Tarantula FX. Chris is a technical analyst, wave analyst, trader, writer, educator, webinar speaker, and seminar speaker of the financial markets.


