EUR/USD Forecast: Three reasons for finally falling out of range
- The EUR/USD slips to lower ground amid concerns over Syria, trade, and the euro-zone growth.
- The ECB Meeting Minutes will likely remain vague on the next moves.
- The technical picture is mixed, but the pair seems vulnerable.

The EUR/USD is trading around $1.2330, down some 0.25% after it started the day in a narrow range. There are several factors weighing on the pair.
1) Syria: There are growing signs that a coalition led by the US may launch an airstrike in Syria. This would be a response to the chemical attack the regime made on its citizens over the weekend. Russia supports the Assad regime, complicating matters. Also, the European Council extended sanctions on Iran that also backs the government. Tensions in the Middle East are weighing on the mood.
2) Further euro-zone weakness: Industrial output in the euro-zone fell by 0.8%, worse than a rise of 0.1% that had been expected. This data point joins a long list of shortcomings in hard and soft data alike.
3) Rising chances of a tighter tightening cycle in the US: The FOMC Meeting Minutes revealed optimism about the US economy and inflation reaching its target. The document, published on Wednesday, came after inflation indeed advanced to 2.4% YoY on the headline and 2.1% YoY on the core. The latter figure is a jump after core figures were stuck at 1.8% YoY for a long time.
Next up, the ECB Meeting Minutes may shed some light on the potential end to the QE program. Earlier this week, the Austrian ECB member Ewald Nowotny said that QE would end this year and pointed to a hike in the deposit rate from -0.40% to -0.20%. However, the central bank disowned his comments, saying they do not reflect the views of the Frankfurt-based institution.
See: ECB meeting accounts Preview: Three pillars of stability in the sea of ambiguity
The US later publishes the weekly Initial Jobless Claims, but the focus in the American session will likely remain on geopolitics.
EUR/USD Technical Picture - some bearish signs
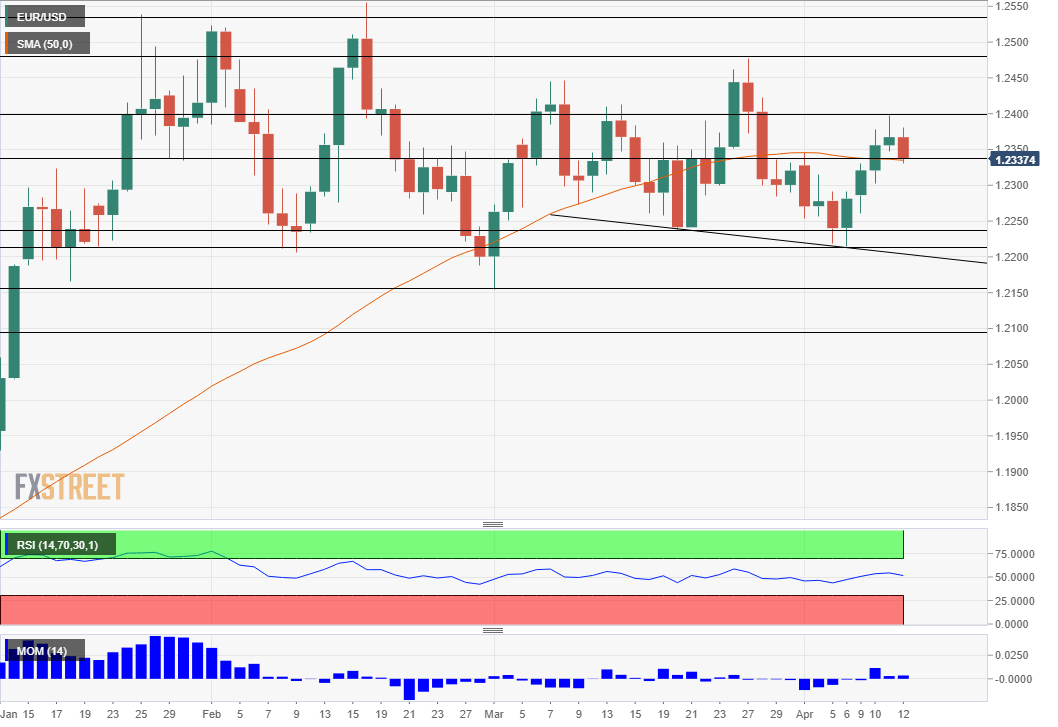
While the RSI and Momentum are close to balanced, we can see that the high recorded on Wednesday represents a higher low. The pair currently clings onto the 50-day Simple Moving Average.
On the topside, the round level of $1.2400 serves as the immediate cap. Further above, $1.2480 seen in late March precedes the 3-year high of $1.2555 seen in February.
Looking down, $1.2330 is the 50-day SMA. A drop opens the door to $1.2240, a low in late March and then $1.2210, a swing low in early April.
More: EUR/USD Forecast: dollar trying to resume post-Fed's advance
Author

Yohay Elam
FXStreet
Yohay is in Forex since 2008 when he founded Forex Crunch, a blog crafted in his free time that turned into a fully-fledged currency website later sold to Finixio.


