EUR/USD Forecast: Next on the downside comes the 200-day SMA
- EUR/USD added to the ongoing weakness and revisited 1.0900.
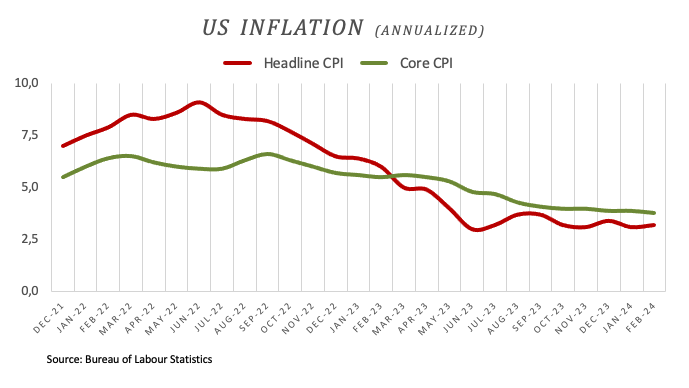
- The Dollar regains traction following US CPI prints.
- Immediately to the downside comes the 200-day SMA.

The steady resurgence of the US Dollar (USD) exerted fresh downward pressure on EUR/USD, leading it to extend the decline for the third session in a row and revisit the proximity of the 1.0900 support.
Simultaneously, the USD Index (DXY) saw a decent uptick, retesting the 103.20 region, as investors analyzed the release of higher-than-expected US inflation figures measured by the CPI.
The Dollar's recovery was further supported by another positive session of US yields across various maturity periods, a move that was mirrored by the German 10-year bund yields, which advanced to the boundaries of 2.35%.
Looking at the broader macroeconomic landscape, both the Federal Reserve (Fed) and the European Central Bank (ECB) are expected to commence their easing cycles early in the summer, likely in June. However, the pace of subsequent interest rate cuts could differentiate the approaches of both central banks. Nonetheless, the ECB is unlikely to lag far behind the Fed.
Based on the FedWatch Tool by CME Group, the likelihood of a rate cut in June has risen to approximately 60%.
In summary, the comparatively sluggish fundamentals of the euro area, in contrast to the resilient US economy, support the expectation of a stronger Dollar in the medium term, especially as both the ECB and the Fed potentially initiate their easing programmes nearly simultaneously. In such a scenario, EUR/USD could undergo a more significant correction, initially targeting its year-to-date low around 1.0700 before potentially revisiting lows from late October 2023/early November in the 1.0500 region.
EUR/USD daily chart
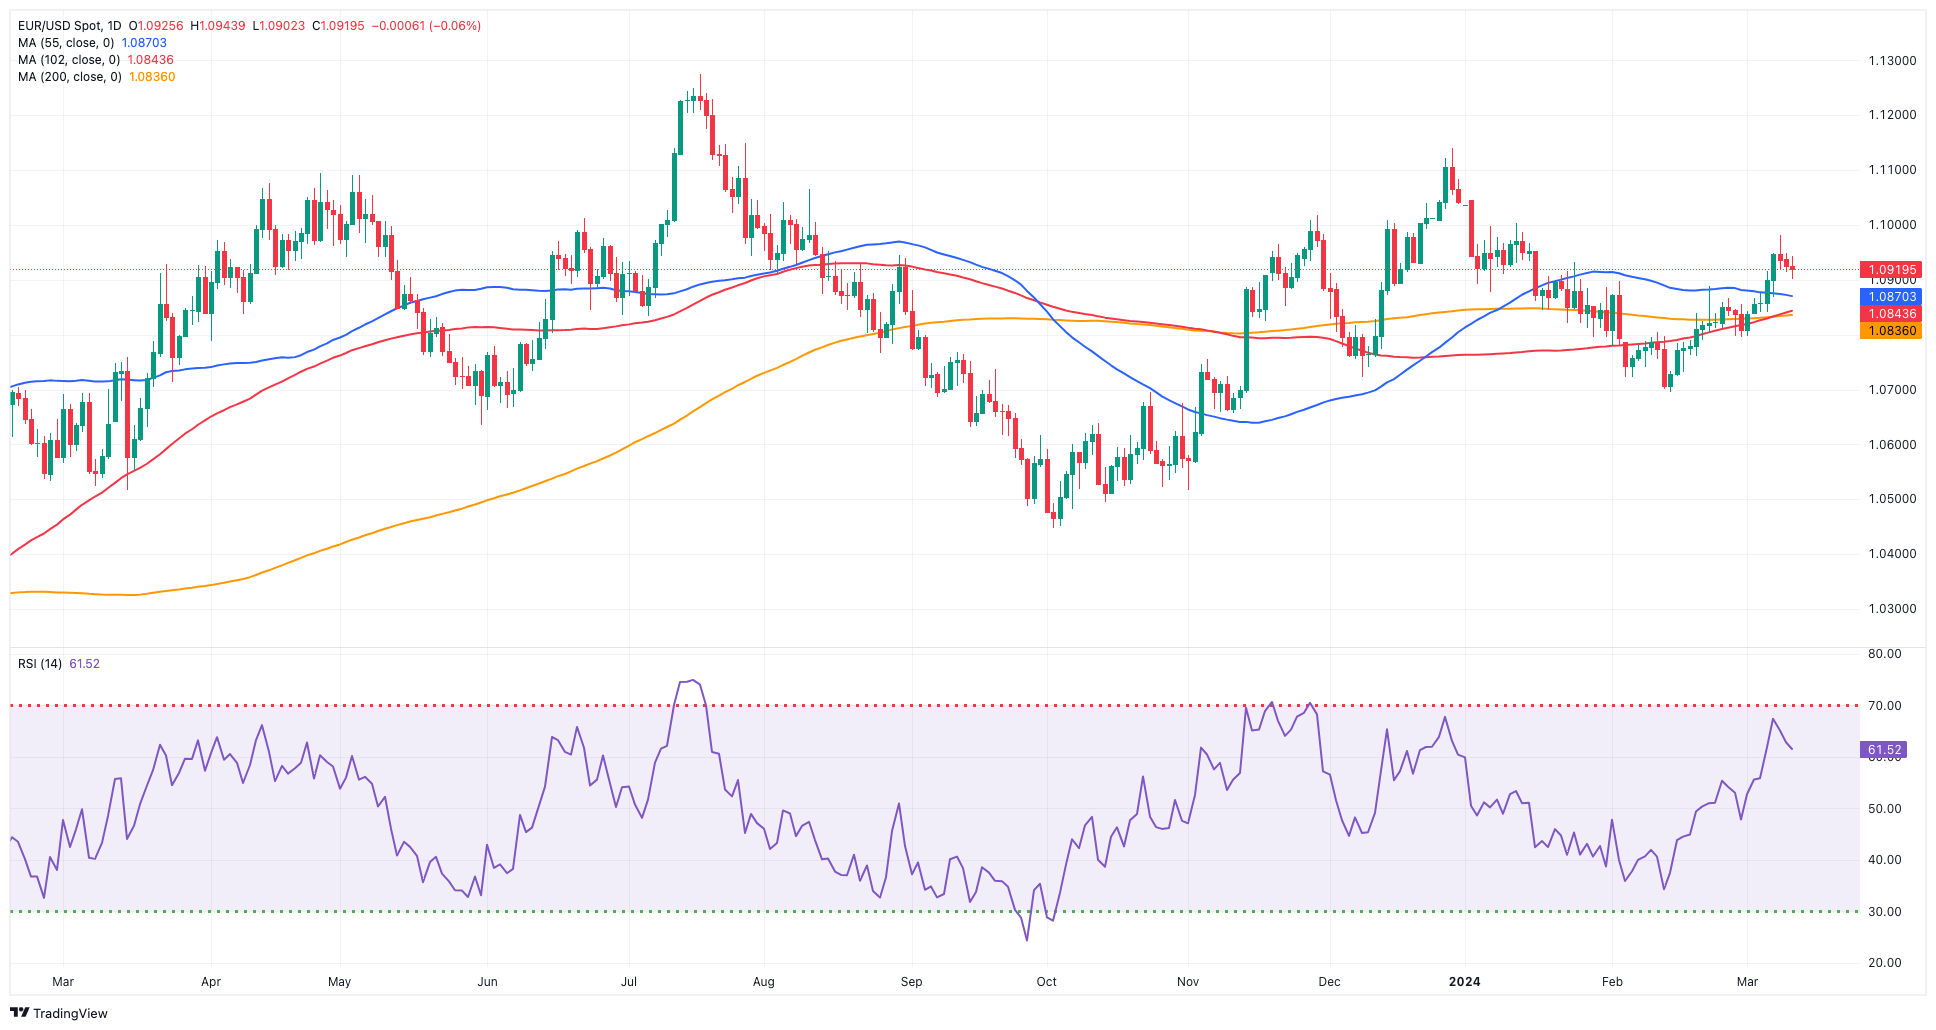
EUR/USD short-term technical outlook
The breakout of the March peak of 1.0981 (March 8) may inspire EUR/USD to launch an attack on the weekly high of 1.0998 (January 11), which strengthens the psychological barrier of 1.1000 and comes ahead of the December 2023 top of 1.1139 (December 28).
On the downside, if the pair goes below the 200-day SMA at 1.0835, it might hit its 2024 low of 1.0694 (February 14). The November 2023 low of 1.0516 (November 1) comes next and is immediately followed by the weekly low of 1.0495 (October 13, 2023), the 2023 low of 1.0448 (October 3), and the round level of 1.0400.
Meanwhile, further gains in EUR/USD remain on the cards while above its 200-day Simple Moving Average (SMA) of 1.0835.
Looking at the 4-hour chart, the pair appears to have embarked on a gradual decline for the time being. That said, the next upward obstacle appears to be 1.0981, followed by 1.0998. The initial level of support is 1.0902 prior to 1.0867, with the 200-SMA at 1.0835 seconded by 1.0761. The Moving Average Convergence Divergence (MACD) stayed positive, while the Relative Strength Index (RSI) eased to the 50 region.
Premium
You have reached your limit of 3 free articles for this month.
Start your subscription and get access to all our original articles.
Author

Pablo Piovano
FXStreet
Born and bred in Argentina, Pablo has been carrying on with his passion for FX markets and trading since his first college years.


