EUR/USD extends wave 3 but pullback in wave 4 expected
-
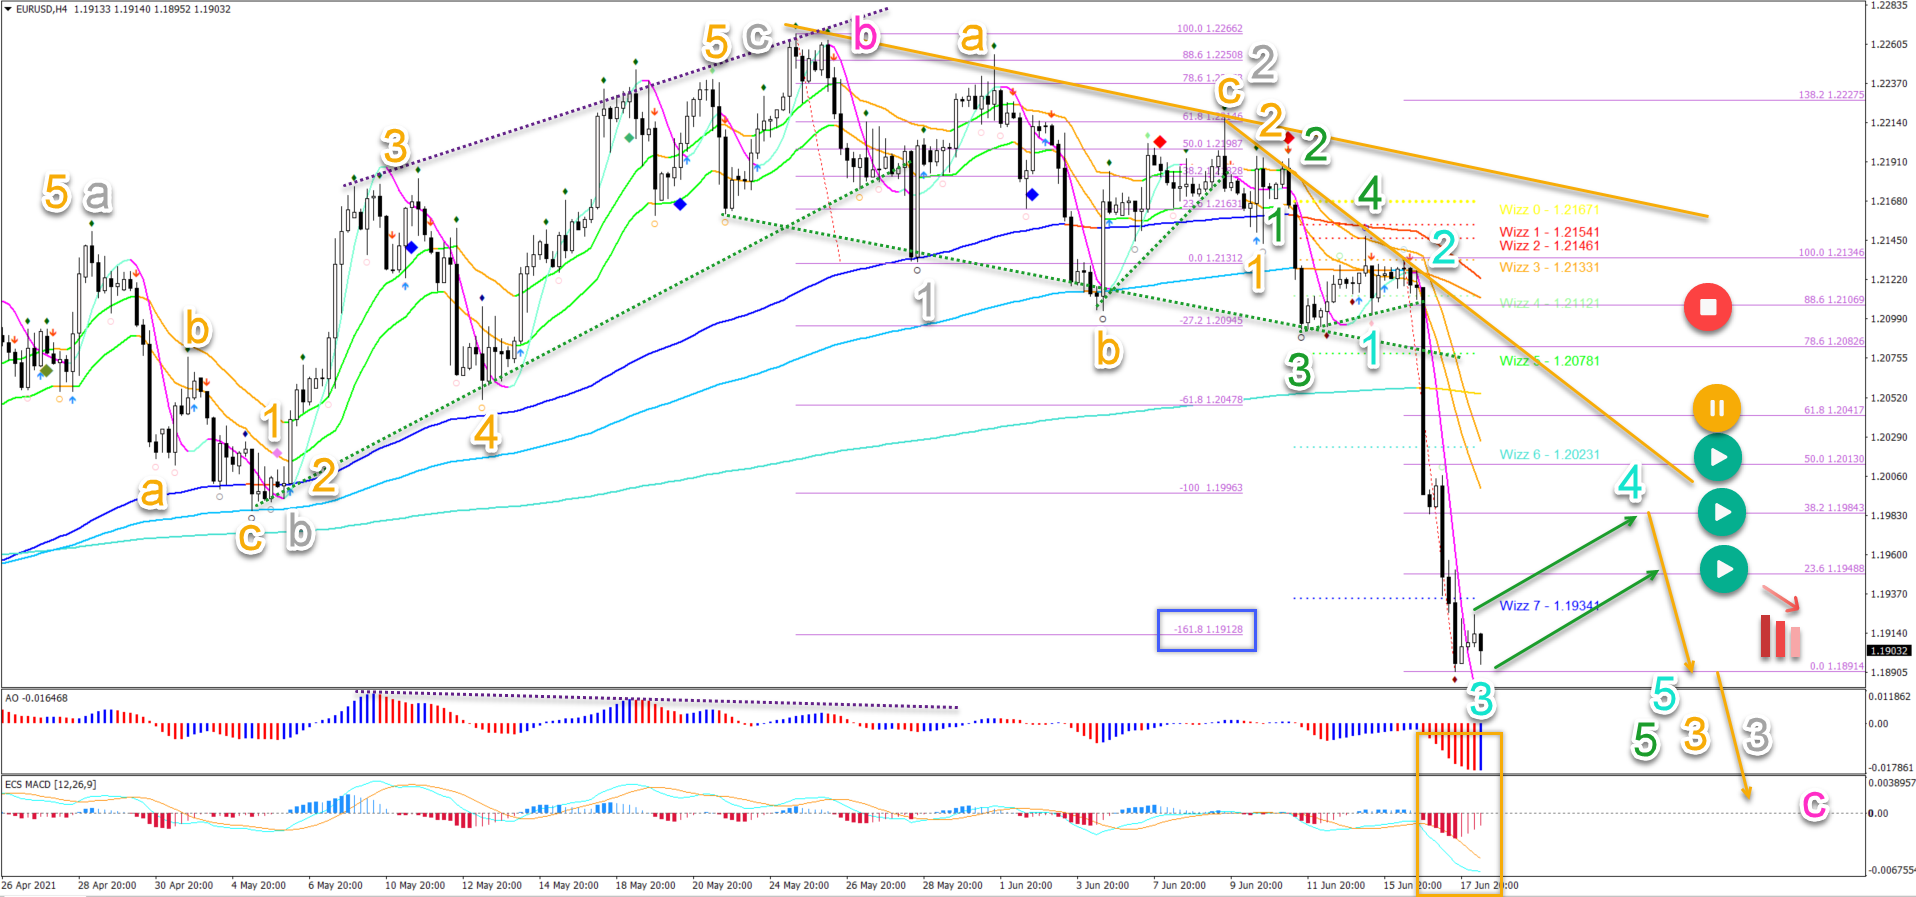
EUR/USD has reached the -161.8% Fibonacci target (blue box). This confirms the development of a wave 3 (orange) of wave 3 (grey).
-
A pullback now at the -161.8% Fibonacci target is likely. Price action has probably completed a wave 3 (blue) and a pullback in wave 4 (blue) is expected.
-
The bearish reversal is part of a larger wave ABC (pink) or 123 pattern on the daily chart.

The EUR/USD has reached the -161.8% Fibonacci target (blue box). This confirms the development of a wave 3 (orange) of wave 3 (grey) as mentioned in our analysis yesterday.
This article will analyse when to expect a pullback, what kind of retracement and how deep based on the Elliott Wave and Fibonacci patterns.
Price charts and technical analysis
The EUR/USD is showing a very strong bearish impulse (orange box). The bearish 4 hour candles are mostly bearish, large and dominant in size, and also closing near the candle lows.
Despite the arrow down, price action is eventually expected to build some type of pullback now or with the next lower low:
-
A pullback now at the -161.8% Fibonacci target is likely. Price action has probably completed a wave 3 (blue) and a pullback in wave 4 (blue) is expected.
-
Usually wave 4s are shallow and choppy pullbacks. The main resistance and bounce levels are the 23.6% Fib and especially the 38.2% Fibonacci level.
-
A break above the 50% Fib places the Elliott Wave outlook on hold (orange circle). A deep retracement invalidates it (red circle).
-
The -27.2% Fibonacci target is located at 1.1825. This is where another wave 4 pattern (orange) could appear.
-
The bearish reversal is part of a larger wave ABC (pink) or 123 pattern on the daily chart.
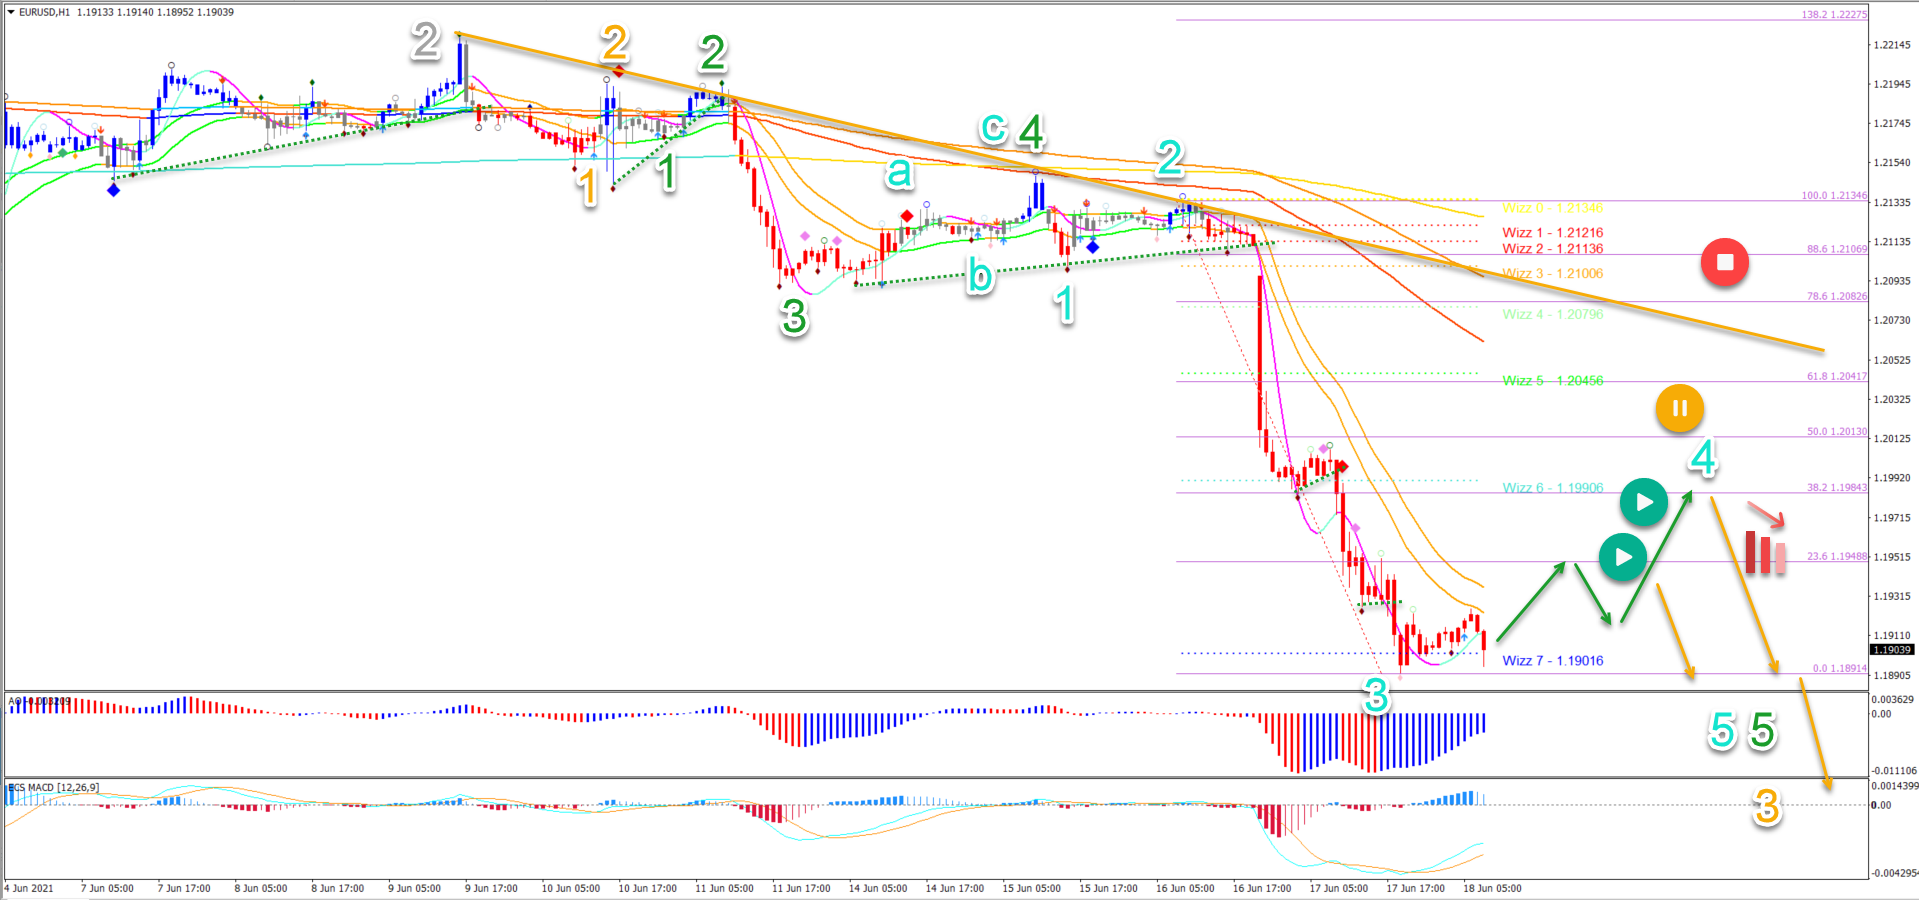
On the 1 hour chart, the wave 3 (blue) impulse is very impulsive as price action fails to even retrace back to the 21 ema low:
-
A break above the 21 ema zone could indicate the start of the wave 4 (blue) pattern.
-
A second re-break below the 21 ema zone could indicate the end of the wave 4 and the start of wave 5 (blue) of wave 5 (green) of wave 3 (orange).
-
As mentioned on the 4 hour charts, a shallow retracement is expected in wave 4 (blue).
The analysis has been done with the ecs.SWAT method and ebook.
Author

Chris Svorcik
Elite CurrenSea
Experience Chris Svorcik has co-founded Elite CurrenSea in 2014 together with Nenad Kerkez, aka Tarantula FX. Chris is a technical analyst, wave analyst, trader, writer, educator, webinar speaker, and seminar speaker of the financial markets.


