EUR/USD Elliott Wave technical analysis [Video]
![EUR/USD Elliott Wave technical analysis [Video]](https://editorial.fxsstatic.com/images/i/eur-usd-fix-01_XtraLarge.jpg)
EUR/USD Elliott Wave technical analysis
Function: Bullish Trend.
Mode: Impulsive.
Structure: Orange Wave 5.
Position: Navy Blue Wave 1.
Direction next lower degrees: Navy Blue Wave 2.
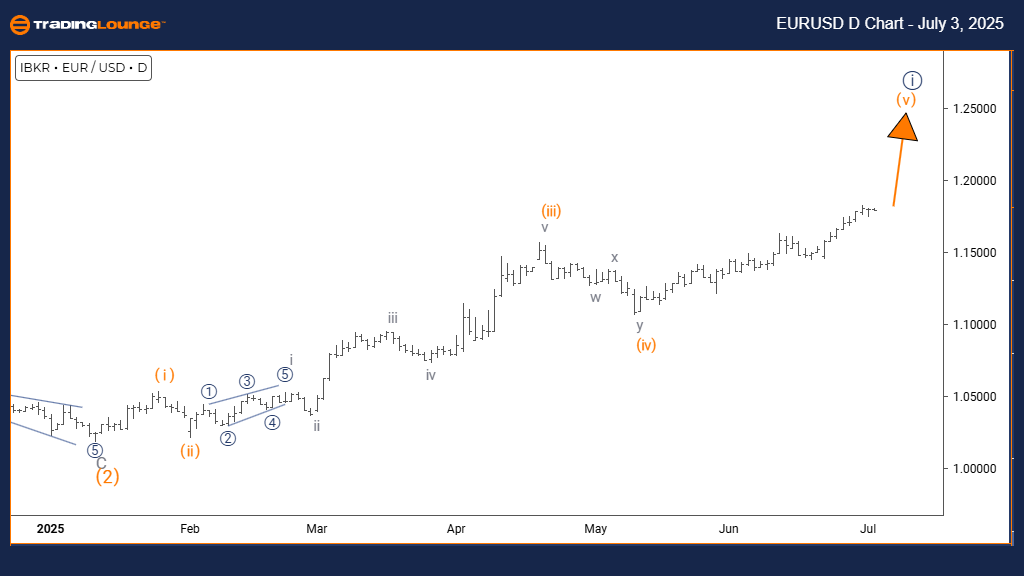
Details: Orange wave 4 appears complete; orange wave 5 is now developing.
Wave cancel invalid level: 1.1433.
The EURUSD daily chart’s Elliott Wave analysis confirms a bullish trend. The market is currently showing impulsive behavior, indicating strong upward momentum. The wave count labels this as orange wave 5, part of a broader wave pattern forming navy blue wave 1. This suggests that EURUSD is in the later phase of an upward impulse within a larger bullish framework.
Orange wave 4 has seemingly completed its corrective move, leading to the initiation of orange wave 5. Typically, this fifth wave of an Elliott sequence often shows significant strength before a reversal or larger corrective phase begins. The next likely movement on a smaller scale is navy blue wave 2, expected once orange wave 5 concludes.
Traders should monitor the key invalidation level of 1.1433 closely. A break below this level would negate the current wave scenario and require a reassessment of the wave structure. So long as price remains above this threshold, the bullish layout remains intact, supporting continued upward progress.
The current wave formation supports the idea of strong bullish momentum, as orange wave 5 advances following the end of wave 4. The impulsive nature of this phase points to firm buying interest. However, traders must be cautious of potential signals that may mark the completion of this fifth wave, as it may signal the end of the ongoing navy blue wave 1 cycle.
EUR/USD Elliott Wave technical analysis
Function: Bullish Trend.
Mode: Impulsive.
Structure: Gray Wave 3.
Position: Orange Wave 5.
Direction next higher degrees: Gray Wave 3 (Initiated).
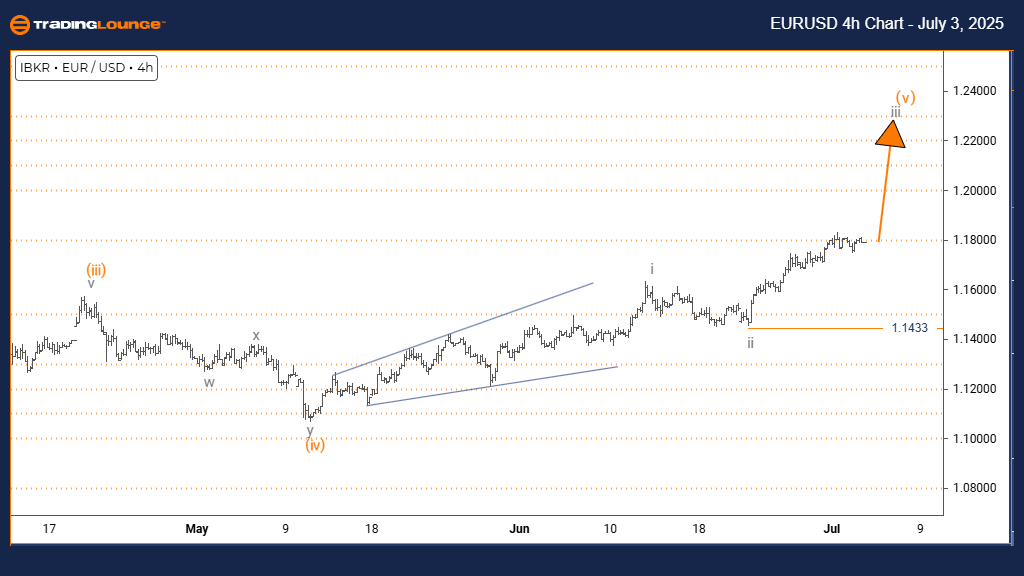
Details: Gray wave 2 appears complete; gray wave 3 is now developing.
Wave cancel invalid level: 1.1433.
The EURUSD 4-hour chart’s Elliott Wave analysis indicates a bullish market stance. The price is in an impulsive state, demonstrating upward momentum. The current wave is labeled gray wave 3, which is part of the broader orange wave 5 sequence. This wave positioning signifies a strong advancing move within an overall bullish trend.
The analysis reveals that gray wave 2 has likely ended its correction, giving way to gray wave 3. This third wave typically carries the most momentum in the Elliott Wave cycle, often producing extended price gains. The next wave to monitor at a higher level is the continuation of gray wave 3 within the orange wave 5 structure.
A critical invalidation point is identified at 1.1433. If price falls below this level, the existing wave count would be considered invalid and a new analysis would be necessary. Until that point, the bullish structure remains valid and implies further price growth.
The technical scenario currently suggests that EURUSD is well-positioned for continued upward progression, with gray wave 3 actively unfolding after gray wave 2 completed. The impulsive nature of this movement reflects strong demand and potential for substantial upward momentum in the near term.
EUR/USD Elliott Wave technical analysis [Video]
Author

Peter Mathers
TradingLounge
Peter Mathers started actively trading in 1982. He began his career at Hoei and Shoin, a Japanese futures trading company.


