EUR/USD Elliott Wave technical analysis [Video]
![EUR/USD Elliott Wave technical analysis [Video]](https://editorial.fxsstatic.com/images/i/EURUSD-neutral-object_XtraLarge.png)
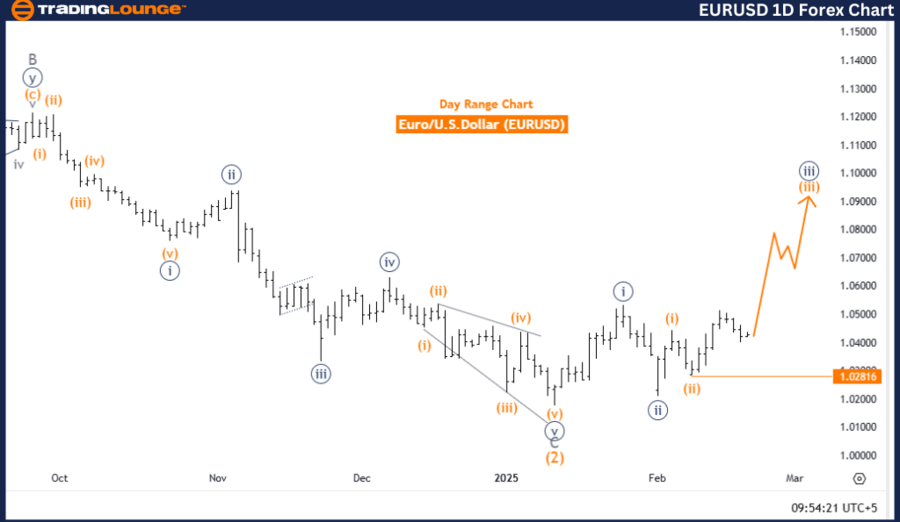
EURUSD Elliott Wave Analysis - Trading Lounge.
Euro/ U.S. Dollar (EURUSD) Day Chart.
EUR/USD Elliott Wave technical analysis
-
Function: Bullish Trend.
-
Mode: Impulsive.
-
Structure: Orange Wave 3.
-
Position: Orange Wave 3.
-
Next higher degree direction: Orange Wave 3 (Started).
-
Wave invalidation level: 1.02816.
The EURUSD Elliott Wave Analysis for the daily chart indicates a bullish trend for the Euro against the US Dollar. This analysis is based on Elliott Wave Theory, which identifies repetitive wave patterns in price movements.
The current market mode is impulsive, indicating strong directional movement. The price structure is identified as Orange Wave 3, which is part of a larger wave sequence, reinforcing a strong bullish phase.
The analysis suggests that Orange Wave 2 appears completed, and Orange Wave 3 is now active. Typically, Wave 3 is the most powerful and extended wave in an Elliott Wave sequence, further strengthening the bullish outlook. The higher-degree wave, Orange Wave 3, has already started, confirming the continuation of the broader uptrend.
A key level to monitor is the wave cancellation invalidation level at 1.02816. If the price drops below this level, the current wave count would be invalidated, potentially altering the bullish outlook. Traders should keep a close watch on this level as it serves as a crucial threshold for confirming the bullish trend.
Conclusion
The EURUSD daily chart analysis suggests that the bullish trend remains intact, with Orange Wave 3 currently in progress. The completion of Orange Wave 2 and the activation of Orange Wave 3 indicate strong upward momentum.
The invalid level at 1.02816 is a crucial price point to monitor, as a break below this level could disrupt the current bullish wave structure. Traders should remain cautious and use this analysis as a reference in their trading decisions. The ongoing impulsive wave structure suggests that the market is likely to maintain its upward movement in the near term.
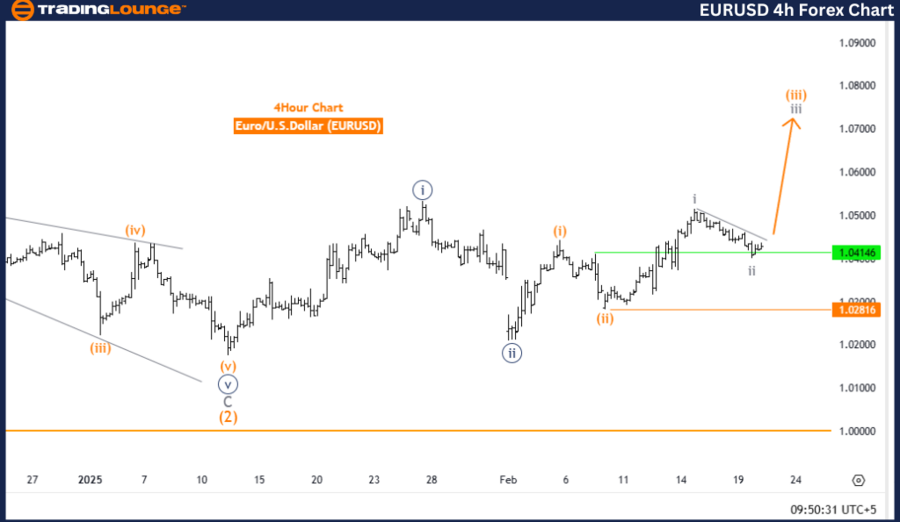
Euro/ U.S. Dollar (EURUSD) 4-Hour Chart.
EUR/USD Elliott Wave technical analysis
-
Function: Bullish Trend.
-
Mode: Impulsive.
-
Structure: Gray Wave 3.
-
Position: Orange Wave 3.
-
Next higher degree direction: Gray Wave 3 (Started).
-
Wave invalidation level: 1.02816.
The EURUSD Elliott Wave Analysis for the 4-hour chart confirms a bullish trend for the Euro against the US Dollar. This analysis applies Elliott Wave Theory, which identifies repetitive wave structures in price movements.
The current market mode is impulsive, indicating strong directional movement. The price structure is identified as Gray Wave 3, forming part of a larger Orange Wave 3, signifying a strong bullish phase.
The analysis indicates that Gray Wave 2 of Orange Wave 3 appears completed, and Gray Wave 3 is now active. Typically, Wave 3 is the most extended and powerful wave in an Elliott Wave sequence, reinforcing the bullish outlook. With Gray Wave 3 already initiated, the broader bullish trend is expected to continue.
A key level to monitor is the wave cancellation invalidation level at 1.02816. If the price falls below this level, the current wave count would be invalidated, possibly shifting the bullish outlook. Traders should closely watch this level as a significant confirmation threshold for the bullish trend.
Conclusion
The EURUSD 4-hour chart analysis suggests that the bullish trend remains intact, with Gray Wave 3 currently in progress. The completion of Gray Wave 2 and the activation of Gray Wave 3 indicate strong upward momentum.
The invalid level at 1.02816 is a crucial price point to monitor, as a break below this level could invalidate the current bullish wave structure. Traders should remain cautious and incorporate this analysis into their trading strategies. The ongoing impulsive wave structure suggests that the market is likely to maintain its upward trajectory in the near term.
Technical analyst: Malik Awais.
EUR/USD Elliott Wave technical analysis [Video]
Author

Peter Mathers
TradingLounge
Peter Mathers started actively trading in 1982. He began his career at Hoei and Shoin, a Japanese futures trading company.


