EUR/USD Elliott Wave technical analysis [Video]
![EUR/USD Elliott Wave technical analysis [Video]](https://editorial.fxsstatic.com/images/i/EURUSD-bearish-object_XtraLarge.png)
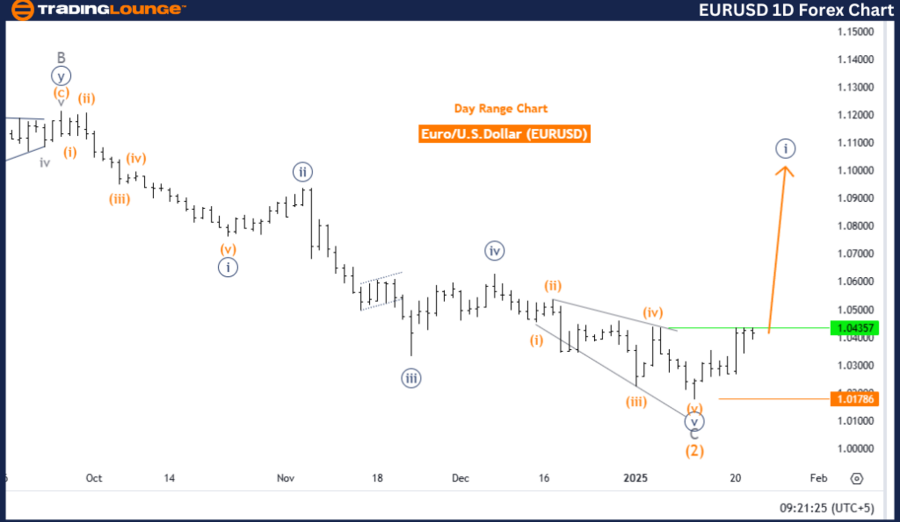
Euro/ U.S. Dollar (EURUSD) – day chart.
EUR/USD Elliott Wave technical analysis
-
Function: Bullish Trend
-
Mode: Impulsive
-
Structure: Navy Blue Wave 1
-
Position: Gray Wave 1
-
Direction (next lower degrees): Navy Blue Wave 2
-
Details: Navy Blue Wave 1 of Gray Wave 1 signals a new trend in play.
-
Wave invalidation level: 1.01786
This analysis provides an in-depth examination of the EURUSD currency pair on the daily chart using Elliott Wave Theory. It identifies an ongoing bullish trend in an impulsive phase, focusing on the development of Navy Blue Wave 1, which is part of the larger Gray Wave 1. This indicates the beginning of a new upward market movement.
The analysis highlights that Navy Blue Wave 1, currently active within the broader framework of Gray Wave 1, reflects strong bullish momentum. This suggests that the market is in the early stages of an extended uptrend. As a next step, the formation of Navy Blue Wave 2 is expected, representing a corrective phase within the broader bullish trend.
The set invalidation level for this analysis stands at 1.01786, marking a crucial point where the current wave structure would be invalidated. If the price falls below this level, the bullish scenario would require reassessment and potential revision.
Key takeaways
-
The analysis suggests a bullish outlook for EURUSD, emphasizing the strength of the initial Navy Blue Wave 1 within the broader Gray Wave 1 trend.
-
The expected development of Navy Blue Wave 2 presents an opportunity for traders to monitor market corrections and plan strategic entries.
-
This insight provides valuable information to align trading strategies with the projected bullish movement.
This structured analysis helps traders understand the market trajectory, offering a strategic approach to align with the ongoing bullish progression.
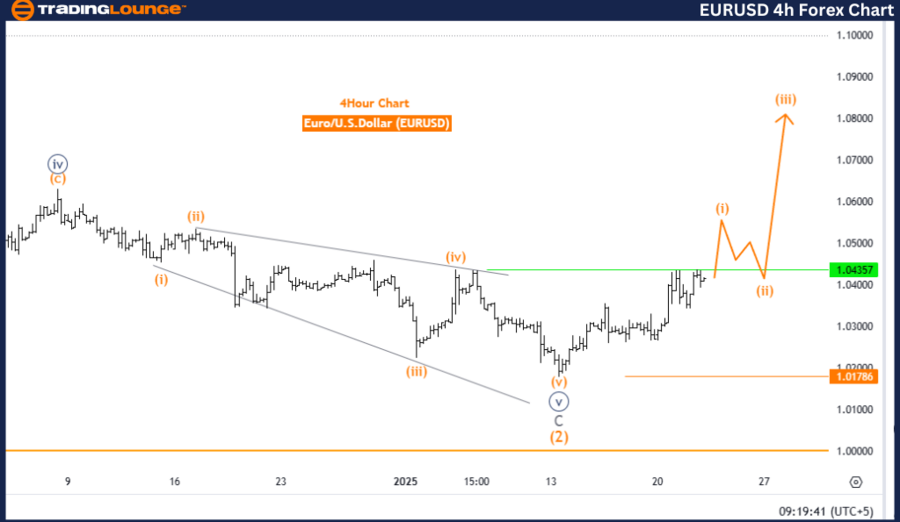
Euro/ U.S. Dollar (EURUSD) – Four-hour chart.
EUR/USD Elliott Wave technical analysis
-
Function: Bullish Trend.
-
Mode: Impulsive.
-
Structure: Orange Wave 1.
-
Position: Navy Blue Wave 1.
-
Direction (next lower degrees): Orange Wave 2.
-
Details: Orange Wave 1 of Navy Blue Wave 1 signals a new trend in play.
-
Wave invalidation level: 1.01786.
This analysis examines the EURUSD currency pair on the 4-hour chart using Elliott Wave Theory. The assessment identifies a bullish trend with an impulsive wave structure, emphasizing the development of Orange Wave 1, which is part of the broader Navy Blue Wave 1. This wave signifies the beginning of a new upward movement in the market.
The analysis reveals that Orange Wave 1 is currently active within the Navy Blue Wave 1 structure, highlighting a strong directional trend. Following this, the chart anticipates the emergence of Orange Wave 2, which is expected to act as a corrective phase to consolidate the gains achieved in the first wave. This pattern aligns with Elliott Wave principles, where an impulsive wave is followed by a corrective wave.
The critical invalidation level is set at 1.01786, serving as a key benchmark to evaluate the sustainability of the current bullish structure. A price drop below this threshold would necessitate a reassessment of the wave count and the overall bullish outlook.
Key takeaways
-
The analysis presents a constructive outlook for EURUSD, emphasizing the strength of the initial Orange Wave 1 within the larger Navy Blue Wave 1 trend.
-
The anticipated formation of Orange Wave 2 offers traders the opportunity to observe potential corrections and align their strategies accordingly.
-
Elliott Wave analysis provides valuable insights into market behavior, aiding in forecasting future price movements and optimizing trading strategies.
This structured analysis helps traders effectively align their trading plans with the evolving market conditions.
EUR/USD Elliott Wave technical analysis [Video]
Author

Peter Mathers
TradingLounge
Peter Mathers started actively trading in 1982. He began his career at Hoei and Shoin, a Japanese futures trading company.


