EUR/USD echoing weakness as dollar index extends gains
EUR/USD:
Europe’s shared currency was on the ropes against its US counterpart on Wednesday, cementing a second session in the red. The US Dollar Index pencilled in another consecutive advance against major peers, eyeing 105.79, 15th June top.
For those who read Wednesday’s technical briefing, you may recall I wrote the following ‘Technical Expectation’:
It’s all about the $1.05 level. In light of the technical evidence (lacklustre demand out of weekly support at $1.0298-1.0445, softened buying and a lack of support visible under $1.05), this suggests an attack on the aforesaid barrier, and perhaps a subsequent drop to at least $1.04.
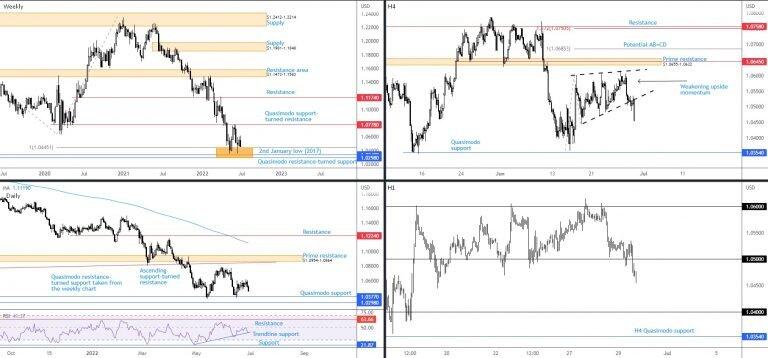
As evident from the H1 timeframe, the currency pair tunnelled under $1.05 in relatively dominant fashion as we headed into US hours on Wednesday. Technically speaking, this perhaps clears the river south to $1.04, given the lack of obvious short-term support seen on the H1 scale until $1.04.
What’s interesting is that further downside is supported by trend direction in this market. Here’s what I had to say about trend in recent writing:
The general trend reflects a primary bear trend, establishing a series of lower lows and lower highs since 2021. Adding to this, seen from the monthly timeframe, the vibe has been to the downside since topping in April 2008. The trend, therefore, is likely one of the main factors discouraging any meaningful buying from current weekly support, made up between Quasimodo resistance-turned support at $1.0298, 2nd January low at $1.0340 (2017), and a 100% Fibonacci projection at $1.0445 (AB=CD harmonic bullish formation).
Out of the daily timeframe, we have Quasimodo support pinned within the current weekly support area at $1.0377. The lack of bullish interest derived from the aforementioned level tells me buyers are largely unresponsive. This is also shown through the daily relative strength index (RSI), holding below its 50.00 centreline and poised to take on indicator trendline support, taken from the low 23.08.
Technical Expectation:
Based on chart studies, sellers may continue to control the tempo, targeting $1.04 on the H1 as an initial support target, closely shadowed by daily Quasimodo support at $1.0377 and H4 Quasimodo support from $1.0354.
AUD/USD:
A well-bid greenback on Wednesday weighed on upside efforts on the AUD/USD, as expected.
I had the following to say in Wednesday’s technical briefing:
This is clearly a bearish market, echoing a possible break of $0.69. Although further losses are in the offing (according to chart studies), H1 Quasimodo support from $0.6842 and H4 support from $0.6833 deliver immediate downside targets to work with.
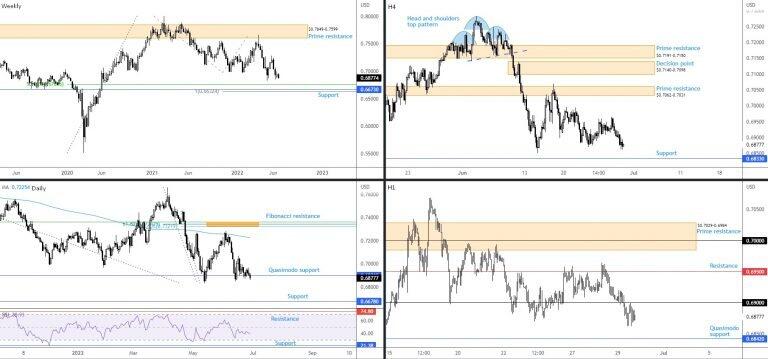
As a reminder, I feel sellers have largely dominated control on the weekly scale since early 2021, together with scope to drop lower to support between $0.6632 and $0.6764 (composed of a 100% Fibonacci projection, a price support, and a 50% retracement).
Here’s where we left trend research in recent writing:
The monthly timeframe has portrayed a downtrend since August 2011, indicating the rally from the pandemic low of $0.5506 (March 2020) to a high of $0.8007 (February 2021) on the weekly timeframe is likely viewed as a deep pullback among long-term chartists. Downside from the 2021 February top (an early primary bear trend), therefore, is potentially seen as a move to explore lower over the coming weeks.
The weekly timeframe’s picture, coupled with daily price on the verge of absorbing Quasimodo support at $0.6901 and the chart’s relative strength index (RSI) continuing to explore space under its 50.00 centreline, suggests weekly support is calling for attention (which houses the next downside daily support target at $0.6678).
Across the page, H1 movement recently retested the lower side of $0.69 and exposed Quasimodo support at $0.6842, as well as H4 support from $0.6833.
Technical Expectation:
Knowing H1 price is navigating space under $0.69, with scope to reach H1 Quasimodo support at $0.6842, together with weekly, daily and H4 price action echoing bearish tones, further downside could be in the offing as we step into Thursday’s session.
USD/JPY:
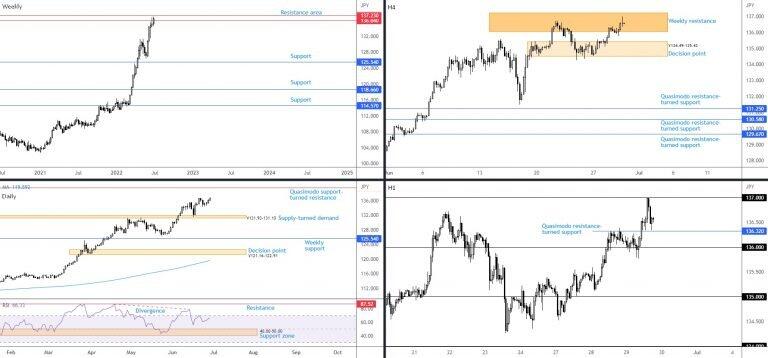
Latest developments on USD/JPY reveal the currency pair refreshed a 24-year peak on Wednesday, touching the ¥137.00 neighbourhood. For what good it is doing, weekly resistance forged between ¥137.23 and ¥136.04 remains in the picture. Breaching this level is likely to keep USD/JPY bulls on the winning side of the table until as high as ¥146ish, according to the weekly chart.
Laying the groundwork for additional upside is not only the decisive uptrend since 2021, but also the daily timeframe’s structure, following a decisive rebound from supply-turned demand at ¥131.93-131.10 and room to strike as far north as Quasimodo support-turned resistance at ¥139.55. In terms of the relative strength index (RSI) on the daily scale, this is a difficult read at the moment, as in strongly trending environments the indicator can remain around overbought space for a prolonged period and deliver false signals. However, I will be keeping a close tab on indicator resistance stationed within overbought at 87.52.
The H4 decision point from ¥134.49-135.43 remains intact, despite having its lower edge clipped last week. As you can see, following a retest of ¥136 on the H1, price action has driven higher into the weekly resistance area underlined above at ¥137.23-136.04. Note, however, that sellers did make their presence felt from the underside of ¥137 in early US trading yesterday, throwing light on H1 Quasimodo resistance-turned support at ¥136.32, and the neighbouring ¥136 figure.
Technical Expectation:
Ultimately, this market continues to work with a healthy bullish tone. With that being the case, dip-buyers could make a show from between ¥136 and H1 Quasimodo resistance-turned support at ¥136.32.
GBP/USD:
Week to date, GBP/USD trades 1.2 per cent lower, in line with a clear long-term downside bias:
Here’s where I left trend research in the previous briefing:
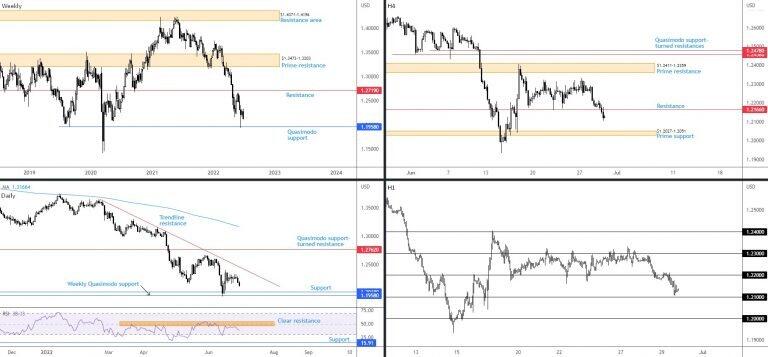
Trend direction in this market is unmistakably bearish, fashioning a series of lower lows/highs since February/May’s double-top formation at around $1.4241 in 2021. Furthermore, seen through the monthly timeframe, the long-term downtrend has actually been soft since late 2007 tops at $2.1161.
Quasimodo support at $1.1958 remains in the picture on the weekly timeframe. Despite mid-June chalking up a noteworthy lower shadow from the noted support, follow-through buying has been mostly non-existent. I initially believed the $1.1958 reaction could drum up sufficient backing to reach trendline resistance on the daily timeframe, taken from the high $1.3639. Leaving the latter unchallenged, nonetheless, a retest of weekly Quasimodo support could now be on the cards and, according to the trend, a break lower may unfold. Supporting a bearish theme, of course, is the daily timeframe’s relative strength index (RSI) remaining under its 50.00 centreline (negative momentum).
From the H4 timeframe, you will note a clean sweep of support at $1.2166 emerged yesterday, returning the level to resistance. Prime H4 support is next on the table at $1.2027-1.2051, yet given the tests seen in mid-June there is an air of weakness surrounding the zone. This informs traders that H1 price is gearing up for a break of $1.21 and a subsequent test of $1.20, a widely watched psychological barrier.
Technical Expectation:
In light of technical studies, a bearish narrative continues to cloud this market. A break of $1.21—likely viewed as a bearish breakout signal—on the H1 would help confirm current weakness and at the same time usher in a possible move towards $1.20.
Author

Aaron Hill
FP Markets
After completing his Bachelor’s degree in English and Creative Writing in the UK, and subsequently spending a handful of years teaching English as a foreign language teacher around Asia, Aaron was introduced to financial trading,


