EUR/USD Double Bottom Reversal Chart Pattern at 1.11

Hi traders,
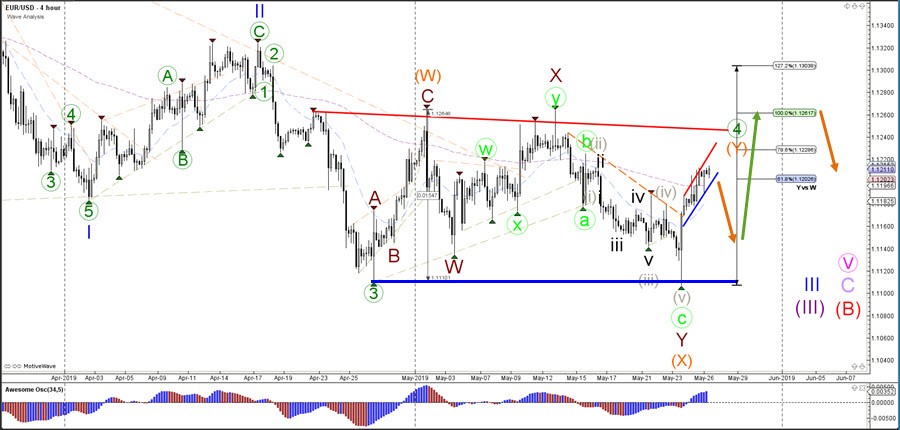
the EUR/USD made a bullish bounce at the previous bottom (blue line), which is indicating a double bottom reversal chart pattern. A continuation of the sideways range pattern seems now more likely.
EUR/USD
4 hour
The EUR/USD seems to be expanding the wave 4 (green) corrective pattern after bouncing at the support line (blue). The bounce indicates the end of a bearish wave X (orange) and the potential start of bullish wave Y (orange). A bullish ABC is likely to take place before price can complete the larger wave 4 (green) pattern. Fibonacci
1 hour
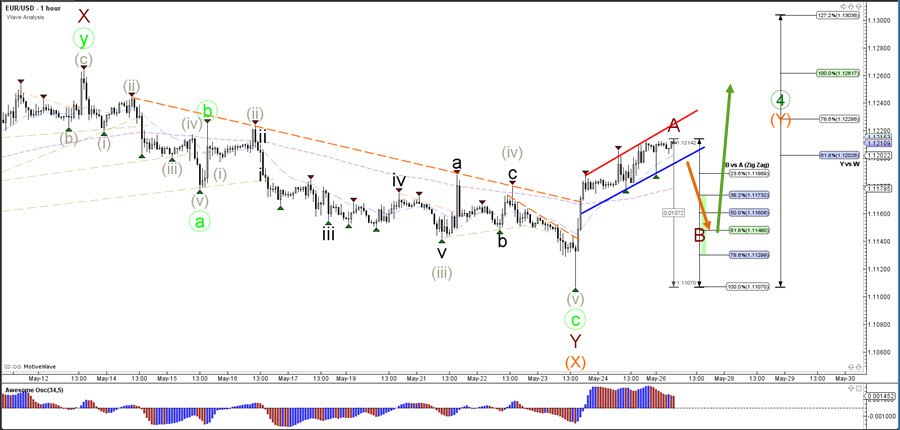
The EUR/USD is building a bullish channel which could be a wave A (dark red) of a potential larger ABC zigzag pattern. A break below the support trend line (blue) indicates the start of a retracement towards the Fibonacci levels of wave B vs A, which could be bouncing spots for a potential larger push up again.
Author

Chris Svorcik
Elite CurrenSea
Experience Chris Svorcik has co-founded Elite CurrenSea in 2014 together with Nenad Kerkez, aka Tarantula FX. Chris is a technical analyst, wave analyst, trader, writer, educator, webinar speaker, and seminar speaker of the financial markets.


