EUR/USD: dollar gathers pace on risk aversion, but gains seen limited

EUR/USD Current price: 1.0720
View Live Chart for the EUR/USD
The American dollar trades marginally higher across the board, gathering pace in the European morning after falling within Asian trading hours. The common currency is among the worst performers this Monday, with the EUR/USD pair down to the current 1.0730 region ahead of Wall Street's opening, despite data coming from the region was better-than-expected. The Sentix Investor Confidence Index for February, came in at 17.4, matching market's expectations, but below previous 18.2. In Germany, Factory Orders rose by 5.2% in December, from a previously revised -3.6%. Still pending of release is the US Labor Market Conditions Index.
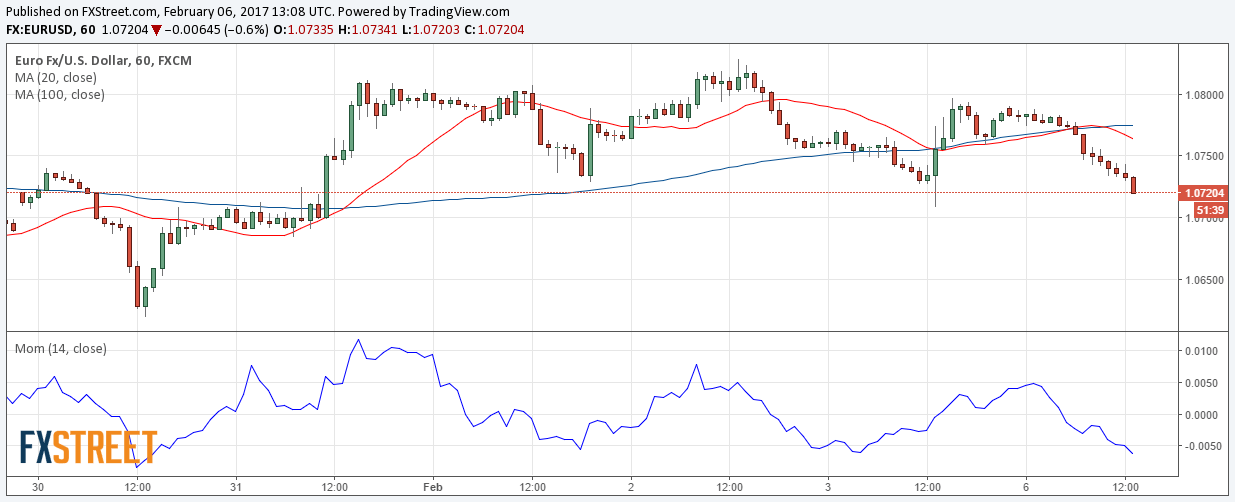
The EUR/USD pair trades around 1.0720, pressuring its daily low and technically bearish according to intraday charts, as in the 1 hour one, the price is now below its 20 and 100 SMAs, whilst technical indicators head south within negative territory, entering oversold levels. In the 4 hours chart, technical indicators have accelerated their declines within negative territory, whilst the 20 SMA gains downward slope above the current level. In the same chart, the 100 SMA stands in the 1.0710 region, alongside with the 38.2% retracement of its November/January slump, with a break below it opening doors for a continued decline towards the 1.0650/60 region.
Support levels: 1.0710 1.0660 1.0620
Resistance levels: 1.0760 1.0800 1.0840
GBP/USD Current price: 1.2469
View Live Chart for the GBP/USD

The GBP/USD pair fell down to 1.2449 with London opening, holding in a tight 30 pips range above. There were no macroeconomic releases in the UK, but concerns about Brexit weigh on the European currency. The UK Parliament is debating the bill that will formally trigger the exit from the EU, and are proposing multiple amendments that will complicate PM May's plans. Also, soft data released over the past two weeks, indicating that the UK's economy lost momentum during the last two months, affects sentiment towards the Pound. Technically, the 1 hour chart shows that the pair is trading below a bearish 20 SMA, unable to advance beyond it despite multiple intraday attempts, whilst technical indicators are gaining downward strength below their mid-lines. In the 4 hours chart, the price is well below a bearish 20 SMA, whilst technical indicators consolidate near oversold territory with no certain directional strength. The low set on January 31st at 1.2411 is the level to break to confirm a steeper decline during the upcoming sessions.
Support levels: 1.2445 1.2410 1.2370
Resistance levels: 1.2490 1.2530 1.2580
USD/JPY Current price: 112.14
View Live Chart for the USD/JPY

The USD/JPY pair nears the 112.00 level ahead of the US opening, undermined by falling equities across Europe. Political uncertainty in the US and Europe favors the safe-haven yen. From a technical point of view, the 1 hour chart shows that the 100 SMA keeps containing rallies, now heading south around 112.80, whilst technical indicators maintain their downward strength within negative territory, supporting further declines ahead, particularly if upcoming US data disappoints. In the 4 hours chart, the RSI indicator has resumed its decline and stands at fresh 3-day lows, although the Momentum indicator lacks directional strength below the 100 level. In this last time frame, the 100 and 200 SMAs maintain sharp bearish slopes well above the current level, supporting a bearish extension on a break below 112.00, the 38.2% retracement of the November/December rally, with scope then to test the 111.60 region, where the pair has its 100 DMA.
Support levels: 112.00 111.60 111.20
Resistance levels: 112.45 112.80 113.25
AUD/USD Current price: 0.7649
View Live Chart for the AUD/USD

The AUD/USD pair eases this Monday, but remains near the multi-month low set last week at 0.7695. A side in equities is being neutralized by higher gold prices, as spot pressures the 1,230.00 level. Also, limiting Aussie´s decline was better-than-expected inflation forecast released overnight, as according to the Melbourne institute, inflation is expected to have risen by 0.6% during January. Short term, the pair is bearish given that in the 1 hour chart, technical indicators have accelerated their declines within negative territory, whilst the price stands below a bearish 20 SMA. In the 4 hours chart, the price is currently breaking below a bullish 20 SMA, whilst the Momentum indicator heads south almost vertically and the RSI also turned lower, but holding around 52, this last indicating that the slide would likely remain limited.
Support levels: 0.7620 0.7580 0.7540
Resistance levels: 0.7650 0.7725 0.7770
Author

Valeria Bednarik
FXStreet
Valeria Bednarik was born and lives in Buenos Aires, Argentina. Her passion for math and numbers pushed her into studying economics in her younger years.

















