EUR/USD analysis: bearish, 1.1875 next strong support

EUR/USD Current price: 1.1922
- Fed's officer mostly hawkish, but doves also have their voice.
- Light macroeconomic calendar extends into Wednesday.
The EUR/USD pair fell down to 1.1915, its lowest since December 28th, settling at the end of the day a couple of pips above the level. Late Monday, Fed's speakers gave the dollar an additional boost, after hinting that at least three rate hikes are on the table for this year. Both, San Francisco´s Williams and Cleveland's Mester, both offered hawkish comments, and even Atlanta Fed President Bostic, usually on the dovish side, pledged for at least two rate hikes this year, despite concerned by low inflation and the increased risk of an inverted yield curve. The greenback remained strong all through the day, despite EU data again signaled solid economic performance through the region. The Union's unemployment rate fell to 8.7% in September, matching market's expectations but the lowest since January 2009, while German's Industrial Production soared in November 3.4%, reversing a previous slide of 1.2%, and the trade balance surplus in the same hit €22.3B. In the US, job opening fell in November to their lowest in six months, as the number of hires was of 5.879M against the previous 5.996M. This Wednesday, the macroeconomic calendar will remain light, with minor releases scheduled in the US.
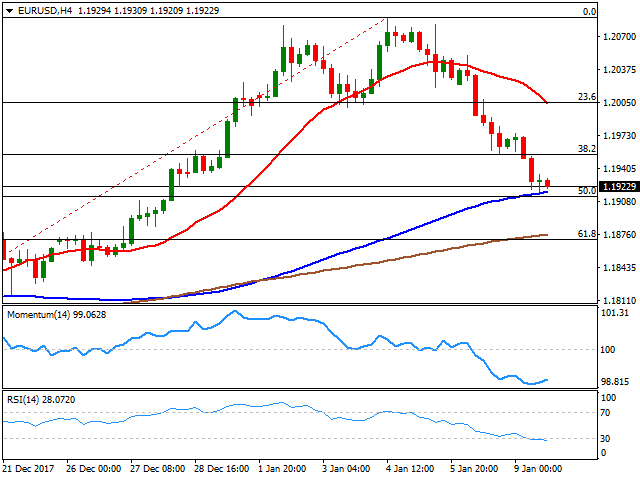
The EUR/USD pair pared losses at a strong support area, but given that the following bounce has been quite shallow, the risk is skewed towards the downside, with a steeper decline seen on an acceleration below the current region. In the 4 hours chart, the 20 SMA gained downward strength above the current level, while the price struggles around a bullish 100 SMA, also with the 50% retracement of the last three-week rally. In the same chart, technical indicators reached oversold conditions, with the Momentum aiming to bounce but the RSI still heading lower, currently at 27, in line with additional declines ahead toward 1.1875, the 61.8% retracement of the mentioned rally.
Support levels: 1.1910 1.1875 1.1830
Resistance levels: 1.1960 1.2000 1.2030
Author

Valeria Bednarik
FXStreet
Valeria Bednarik was born and lives in Buenos Aires, Argentina. Her passion for math and numbers pushed her into studying economics in her younger years.
















