|

EUR/NZD selling the rallies at the blue box area

In this technical article we’re going to take a quick look at the Elliott Wave charts of EURNZD published in members area of the website.  As our members know, the pair is showing incomplete bearish sequences in the cycle from the August 21st peak that are calling for more downside. The pair is targeting 1.7329 area ideally.  Our team recommended members to avoid buying , while keep favoring the short side in the pair.  Recently we got correction that reached our selling zone. The pair found sellers and made reaction from the blue box as expected. In the further text we are going to explain the Elliott Wave Forecast and trading strategy.

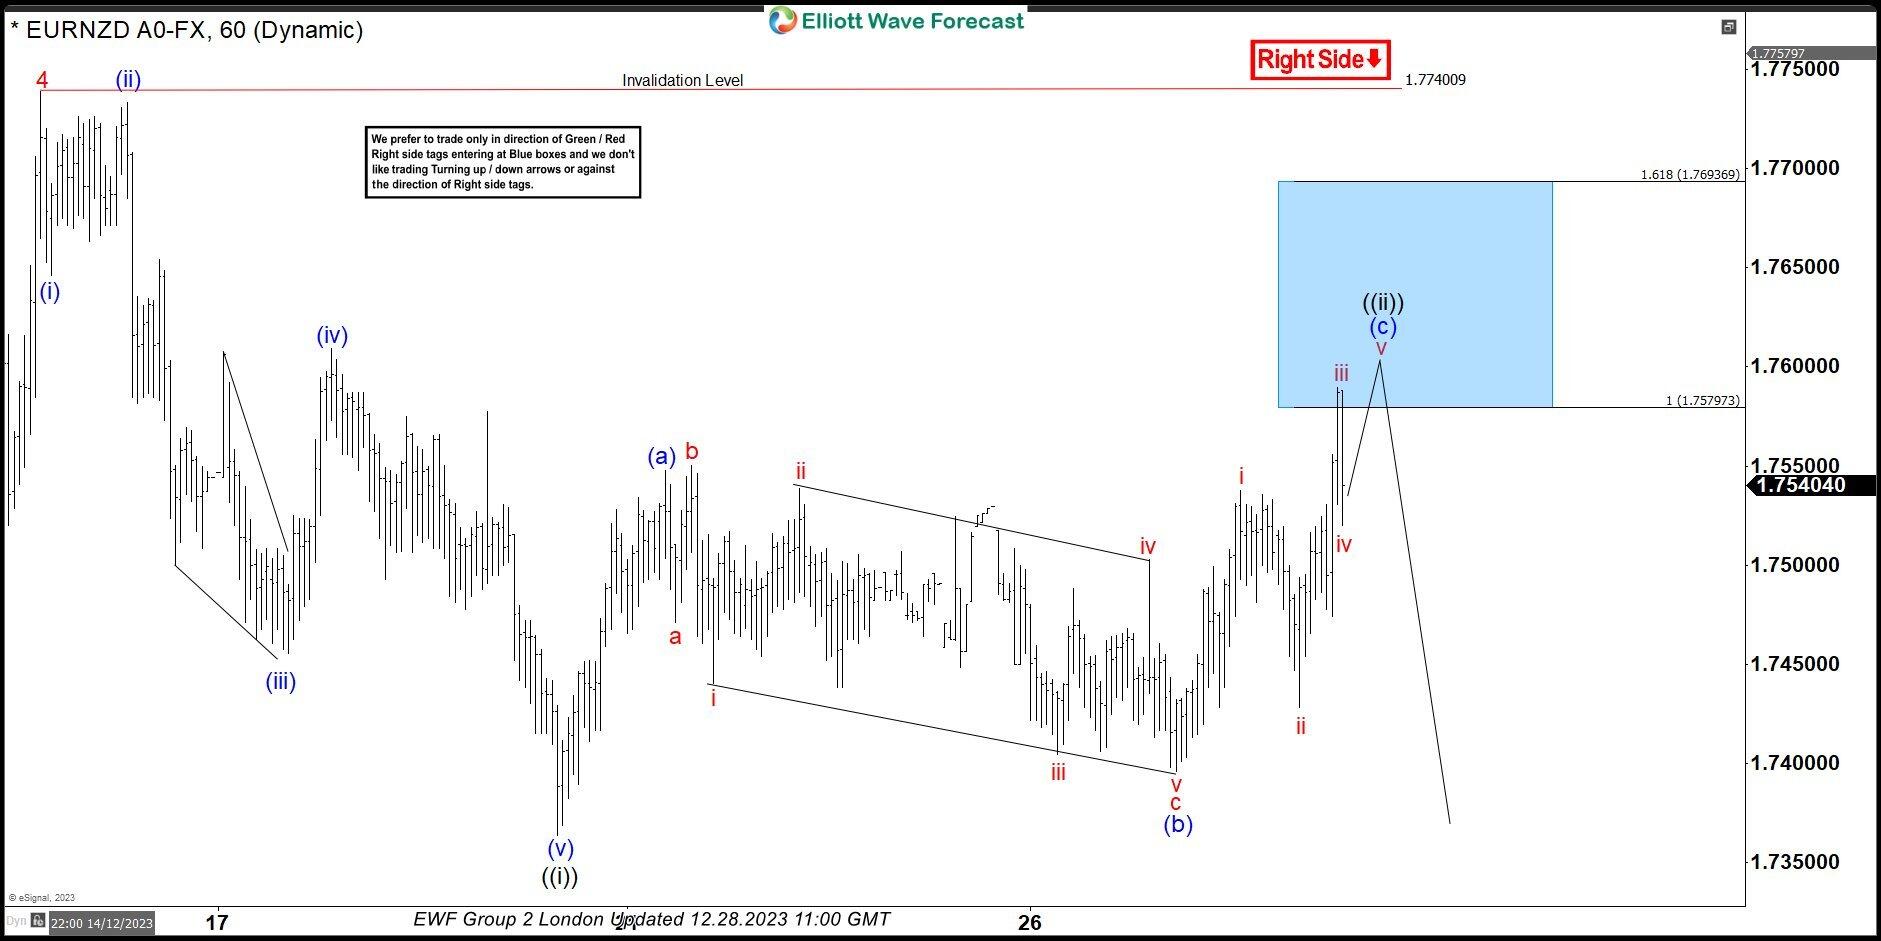
EUR/NZD Elliott Wave one hour chart 12.28.2023

The pair is giving us wave ((ii)) recovery which is correcting the cycle from the 1.774 peak. The price has reached extreme zone at  1.7579-1.7693 ( Blue Box – sellers zone). We don’t recommend buying the pair and prefer the short side from the blue box- equal legs zone. As the main trend is bearish, we expect to see at least 3 waves pull back from our selling zone.  Once decline reaches 50 Fibs against the (b) blue low, we will make short position risk free ( put SL at BE) and take partial profits. Invalidation for the short trades is break of 1.618 fib ext : 1.7693.

EURNZD

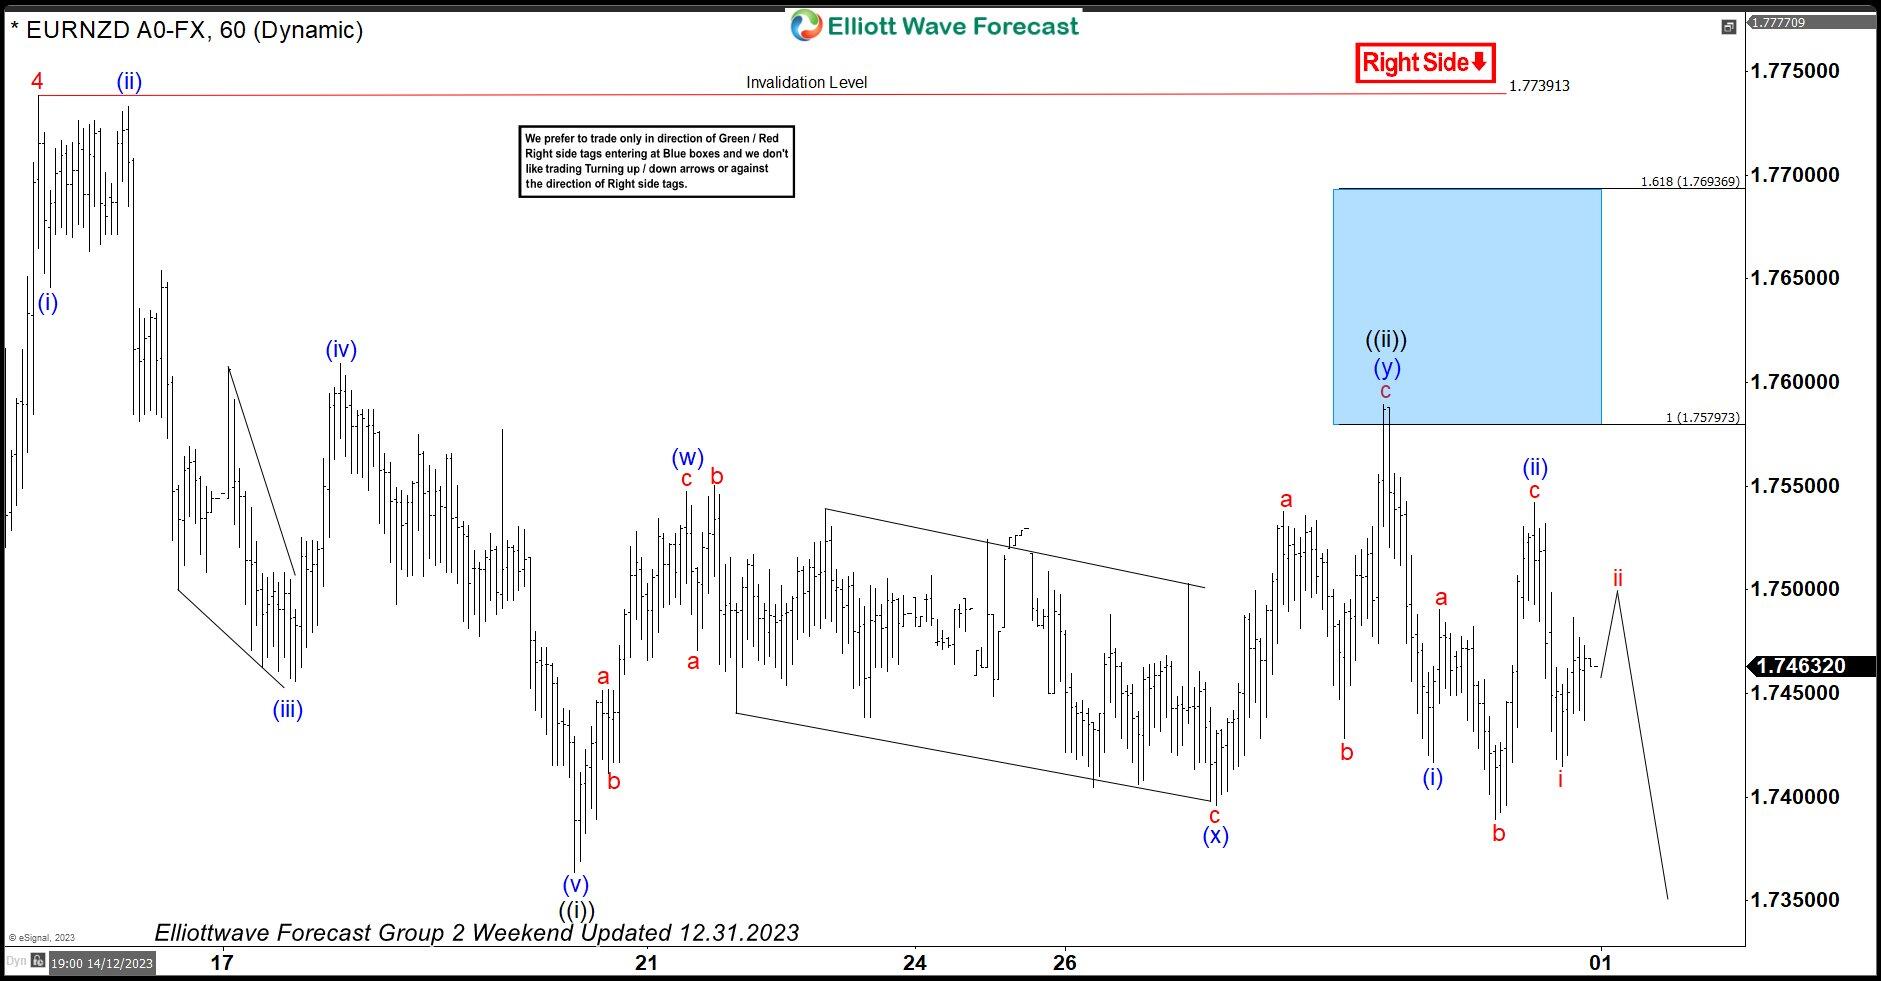
EUR/NZD Elliott Wave one hour chart 12.31.2023

The pair found sellers right at the Blue Box area : 1.7579-1.7693.  Recovery completed at the 175.88 high and we are getting good reaction from the selling zone. Decline reached and exceeded 50 fibs against the connector’s low. So members who took the short trade are enjoying profits now in a risk free positions. While below 175.88 high, next leg down can be in progress toward new lows.

EURNZD

Author

Elliott Wave Forecast Team

Elliott Wave Forecast Team

ElliottWave-Forecast.com

More from Elliott Wave Forecast Team
Share:

Editor's Picks

EUR/USD stays depressed near 1.1850 ahead of German ZEW

EUR/USD remains in the red near 1.1850 in the European session on Tuesday. A broad US Dollar bullish consolidation combined with a softer risk tone keep the pair undermined ahead of the German ZEW sentiment survey. 

GBP/USD drops below 1.3600 after weak UK jobs report

GBP/USD is seeing a fresh selling wave, giving up the 1.3600 level in Tuesday's European trading. The United Kingdom employment data showed worsening labor market conditions, bolstering bets for a BoE interest rate cut next month. This narrative is weighing heavily on the Pound Sterling. 

Gold pares intraday losses; keeps the red above $4,900 amid receding safe-haven demand

Gold (XAU/USD) attracts some follow-through selling for the second straight day and dives to over a one-week low, around the $4,858 area, heading into the European session on Tuesday. 

Pi Network rallies ahead of its first anniversary

Pi Network trades above $0.1800 at the time of writing on Tuesday, recording nearly 5% gains so far. On-chain data indicate that large wallet investors, commonly known as whales, have accumulated approximately 4 million PI tokens over the last 24 hours.

The week ahead: Key inflation readings and why the AI trade could be overdone

It is likely to be a quiet start to the week, with US markets closed on Monday for Presidents Day. European markets are higher across the board and gold is clinging to the $5,000 level after the tamer than expected CPI report in the US reduced haven flows to precious metals.

Stellar mixed sentiment caps recovery

Stellar price remains under pressure, trading at $0.170 on Tuesday after failing to close above the key resistance on Sunday. The derivatives metric supports the bearish sentiment, with XLM’s short bets rising among traders and funding rates turning negative.