EUR/JPY Arrives at Massive Decision Zone

Meta description:
The EUR/JPY is either completing a wave 3 (purple) or C (blue). The resistance trend lines are the key decision zone because a bounce or breakout will determine the next movement.
EUR/JPY
4 hour
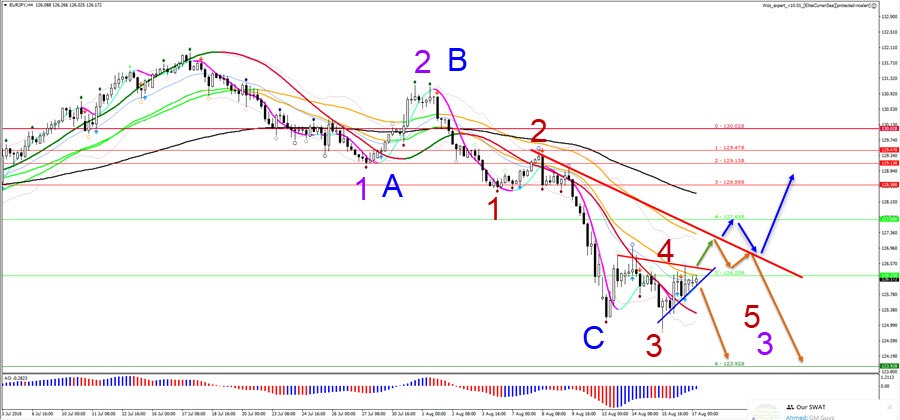
The EUR/JPY is either completing a wave 3 (purple) or C (blue). The resistance trend lines are the key decision zone because a bounce or breakout will determine the next movement.
The EUR/JPY is building a triangle chart pattern, which could be a wave 4 (red) within wave 3 (blue). This scenario becomes likely either if price breaks below the support trend line (blue) or if price breaks the triangle to the upside but bounces at the resistance trend line (red). The orange arrows indicate that the main target is the 6th wizz level. A bullish breakout above the resistance trend line and 4th wizz level could indicate a larger bullish ABC, which in turn means that the downside was an ABC (blue) rather than a 123 (purple).
Daily
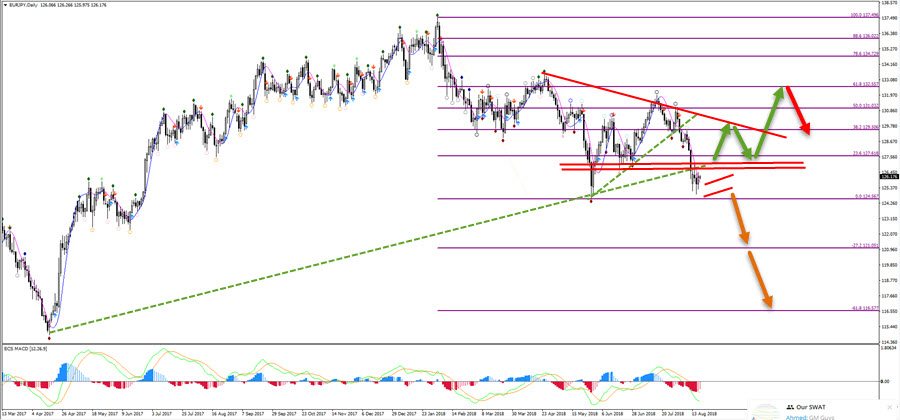
The EUR/JPY has broken below multiple support trend lines (dotted green). A bear flag (orange lines) could indicate a continuation to the down side (orange arrows). A break above the resistance zone (red lines) at around 127 could indicate a bigger bullish ABC pattern (green arrows) towards the 61.8% Fibonacci retracement level.
Author

Chris Svorcik
Elite CurrenSea
Experience Chris Svorcik has co-founded Elite CurrenSea in 2014 together with Nenad Kerkez, aka Tarantula FX. Chris is a technical analyst, wave analyst, trader, writer, educator, webinar speaker, and seminar speaker of the financial markets.


