EUR/GBP may drop out of running triangle [Video]
![EUR/GBP may drop out of running triangle [Video]](https://editorial.fxstreet.com/images/Markets/Currencies/Crosses/EURGBP/eurgbp.jpg)
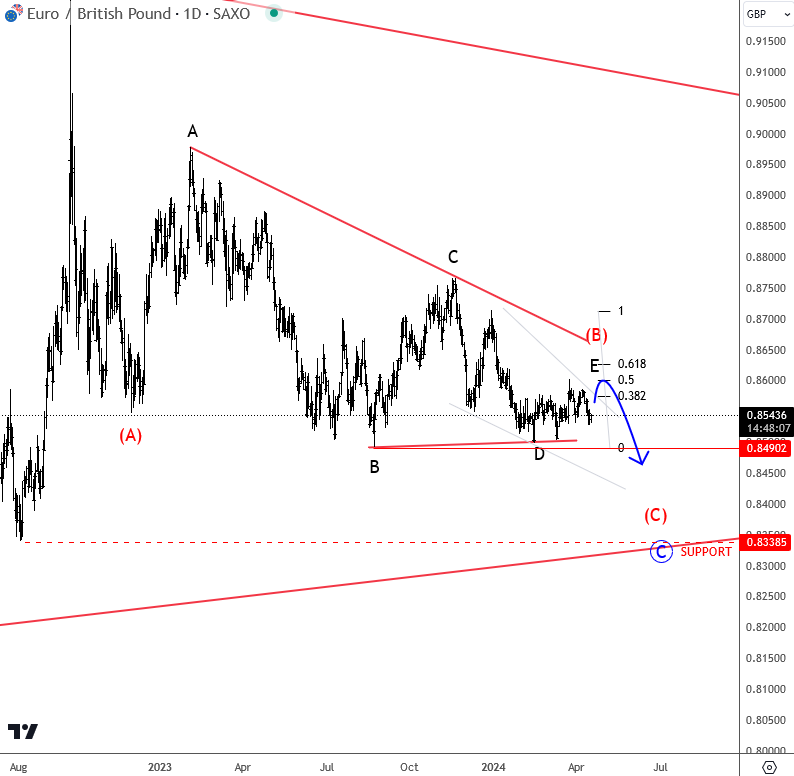
EURGBP is slow and sideways and trapped in big range when looking at monthly or weekly charts, so it seems that pair is trapped in a very big complex consolidation, possibly even in an A-B-C-D-E triangle within wave (B). In a triangle, each leg is made by three waves; (A)-(B)-(C); and with recent sideways price action on a daily chart, seems like we have another, lower degree running triangle pattern in wave (B) before we will see more weakness for wave (C) of C. After current recovery to 0,86 area, which can be final subwave E of (B), we see room for a drop to around 0.8450 - 0.83, where bears can slow down, at the lower side of a monthly ranges.
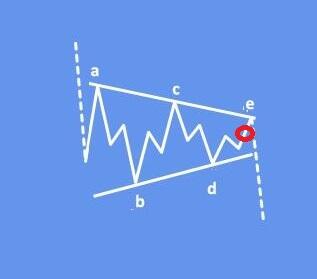
A triangle appears to reflect a balance of forces, causing a sideways movement that is usually associated with decreasing volume and volatility. The triangle pattern contains five overlapping waves that subdivide 3-3-3-3-3 and are labeled A-B-C-D-E. The running triangle is a region of horizontal price movement, a consolidation of a prior move, and it is composed of "threes." That means each of the A-B-C-D-E waves have three subwaves. The triangle pattern is generally categorized as a continuation pattern, meaning that after the pattern completes, it’s assumed that the price will continue in the trend direction it was moving before the pattern appeared. However, triangles also indicate that the final leg is coming before a reversal and that's why triangles are labeled in wave B, wave X or wave 4.
For more analysis like this you may want to watch below our recording of a latest live webinar streamed on April 15 2024:
Get Full Access To Our Premium Elliott Wave Analysis For 14 Days. Click here.
Get Full Access To Our Premium Elliott Wave Analysis For 14 Days. Click here.
Author

Gregor Horvat
Wavetraders
Experience Grega is based in Slovenia and has been in the Forex market since 2003.


