EUR/GBP Elliott Wave technical analysis [Video]
![EUR/GBP Elliott Wave technical analysis [Video]](https://editorial.fxstreet.com/images/Markets/Currencies/Crosses/EURGBP/display-stock-market-data-28943278_XtraLarge.jpg)
EUR/GBP Elliott Wave technical analysis
Function: Counter Trend.
Mode: Corrective.
Structure: Red wave B.
Position: Blue wave X.
Direction next higher degrees: Red wave C of X.
Details: Red wave b of blue wave X looking still is in play as triangle.
Wave cancel invalid level: 0.85001.
The EUR/GBP Elliott Wave Analysis for the day chart provides a comprehensive overview of the potential price movements for the Euro against the British Pound, utilizing Elliott Wave principles for technical analysis.
Identified as a "Counter Trend," the analysis indicates that the current market direction opposes the prevailing trend. This suggests that the EUR/GBP pair may be undergoing a temporary corrective phase, providing opportunities for traders who anticipate a reversal in the broader trend.
Described as "Corrective" in mode, the analysis suggests that the ongoing market movement exhibits characteristics of a corrective wave. This implies that the current price action may represent a temporary retracement or consolidation within the larger trend, rather than a continuation of the primary trend.
The "STRUCTURE" is labeled as "red wave B," providing clarity on the current phase of the Elliott Wave cycle. This helps traders understand the nature of the corrective movement and its potential implications for future price action.
Positioned as "blue wave X," the analysis highlights the specific phase of the Elliott Wave cycle within the current corrective movement. This indicates that the market is currently in a corrective phase following the completion of a previous wave cycle, potentially indicating a complex correction pattern.
In the "DIRECTION NEXT HIGHER DEGREES" section, the analysis mentions "red wave C of X," suggesting the anticipated direction for the subsequent higher-degree wave within the Elliott Wave cycle. This implies that the market may experience another corrective phase following the completion of the current corrective wave, providing insights into potential future price movements.
The "DETAILS" section notes that "red wave b of blue wave X looking still is in play as a triangle." This suggests that the ongoing corrective wave may be taking the form of a triangle pattern, characterized by overlapping price movements and diminishing volatility. Additionally, the wave cancel level is identified at 0.85001, providing a reference point for invalidating the wave count. Traders can utilize this information to evaluate potential trading opportunities and manage risk effectively.

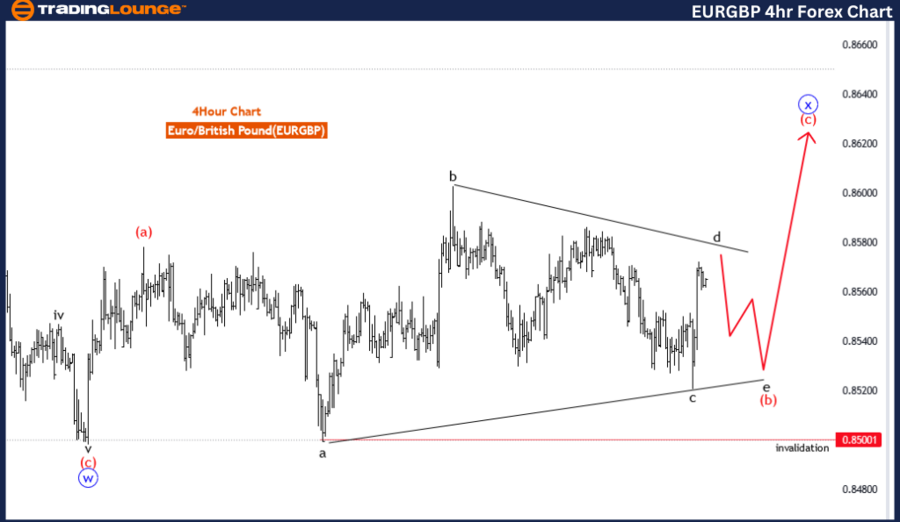
EUR/GBP four-hour chart
Function: Counter Trend.
Mode: Corrective.
Structure: Red wave B.
Position: Blue wave X.
Direction next higher degrees: Red wave C of X
Details: Red wave b of blue wave X looking still is in play as a triangle .
Wave cancel invalid level: 0.85001
The EUR/GBP Elliott Wave Analysis for the 4-hour chart provides insights into the potential price movements of the Euro against the British Pound, employing Elliott Wave principles for technical analysis.
Identified as a "Counter Trend," the analysis suggests that the current market movement opposes the prevailing trend. This indicates that the EUR/GBP pair may be undergoing a temporary corrective phase against the dominant trend direction, presenting potential trading opportunities for contrarian traders.
Described as "Corrective" in mode, the analysis indicates that the ongoing market movement exhibits characteristics of a corrective wave. This suggests that the current price action may represent a temporary pause or retracement within the broader trend, rather than a continuation of the primary trend.
The "STRUCTURE" is labeled as "red wave B," providing clarity on the current phase of the Elliott Wave cycle. This assists traders in understanding the nature of the corrective movement and its potential impact on future price action.
Positioned as "blue wave X," the analysis highlights the specific phase of the Elliott Wave cycle within the current corrective movement. This suggests that the market is currently in the corrective phase following the completion of a previous wave cycle, potentially indicating a complex correction pattern.
In the "DIRECTION NEXT HIGHER DEGREES" section, the analysis mentions "red wave C of X," indicating the anticipated direction for the subsequent higher-degree wave within the Elliott Wave cycle. This suggests that the market may experience a subsequent corrective phase following the completion of the current corrective wave, offering insights into future price movements.
The "DETAILS" section notes that "red wave b of blue wave X looking still is in play as a triangle." This suggests that the ongoing corrective wave may be taking the form of a triangle pattern, characterized by overlapping price movements and diminishing volatility. Additionally, the wave cancel level is noted at 0.85001, serving as a reference point for invalidating the wave count. Traders may use this information to assess potential trading opportunities and manage risk accordingly.
EUR/GBP Elliott Wave technical analysis [Video]
Author

Peter Mathers
TradingLounge
Peter Mathers started actively trading in 1982. He began his career at Hoei and Shoin, a Japanese futures trading company.


