Breaking down the timeframes
Background: The UK economy has not collapsed, the borders are still open and there is food on the shelves! Hey ho Brexit! This has resulted in EURGBP drifting lower. I believe this is more on Euro weakness than GBP strengthI want to look at EURGBP this morning with a focus on correlation using the GBPUSD and EURUSD charts.
EUR/GBP Monthly
I wanted to look at this frightening looking chart to start with. If this formation plays out, then a Crab formation is seen all the way down at 0.3336-0.3143. This would have to suggest a complete meltdown in the Euro system. The fact it has reacted so well from the 88.6% level at 0.9485 gives the formation a bit more strength and fills me with dread!
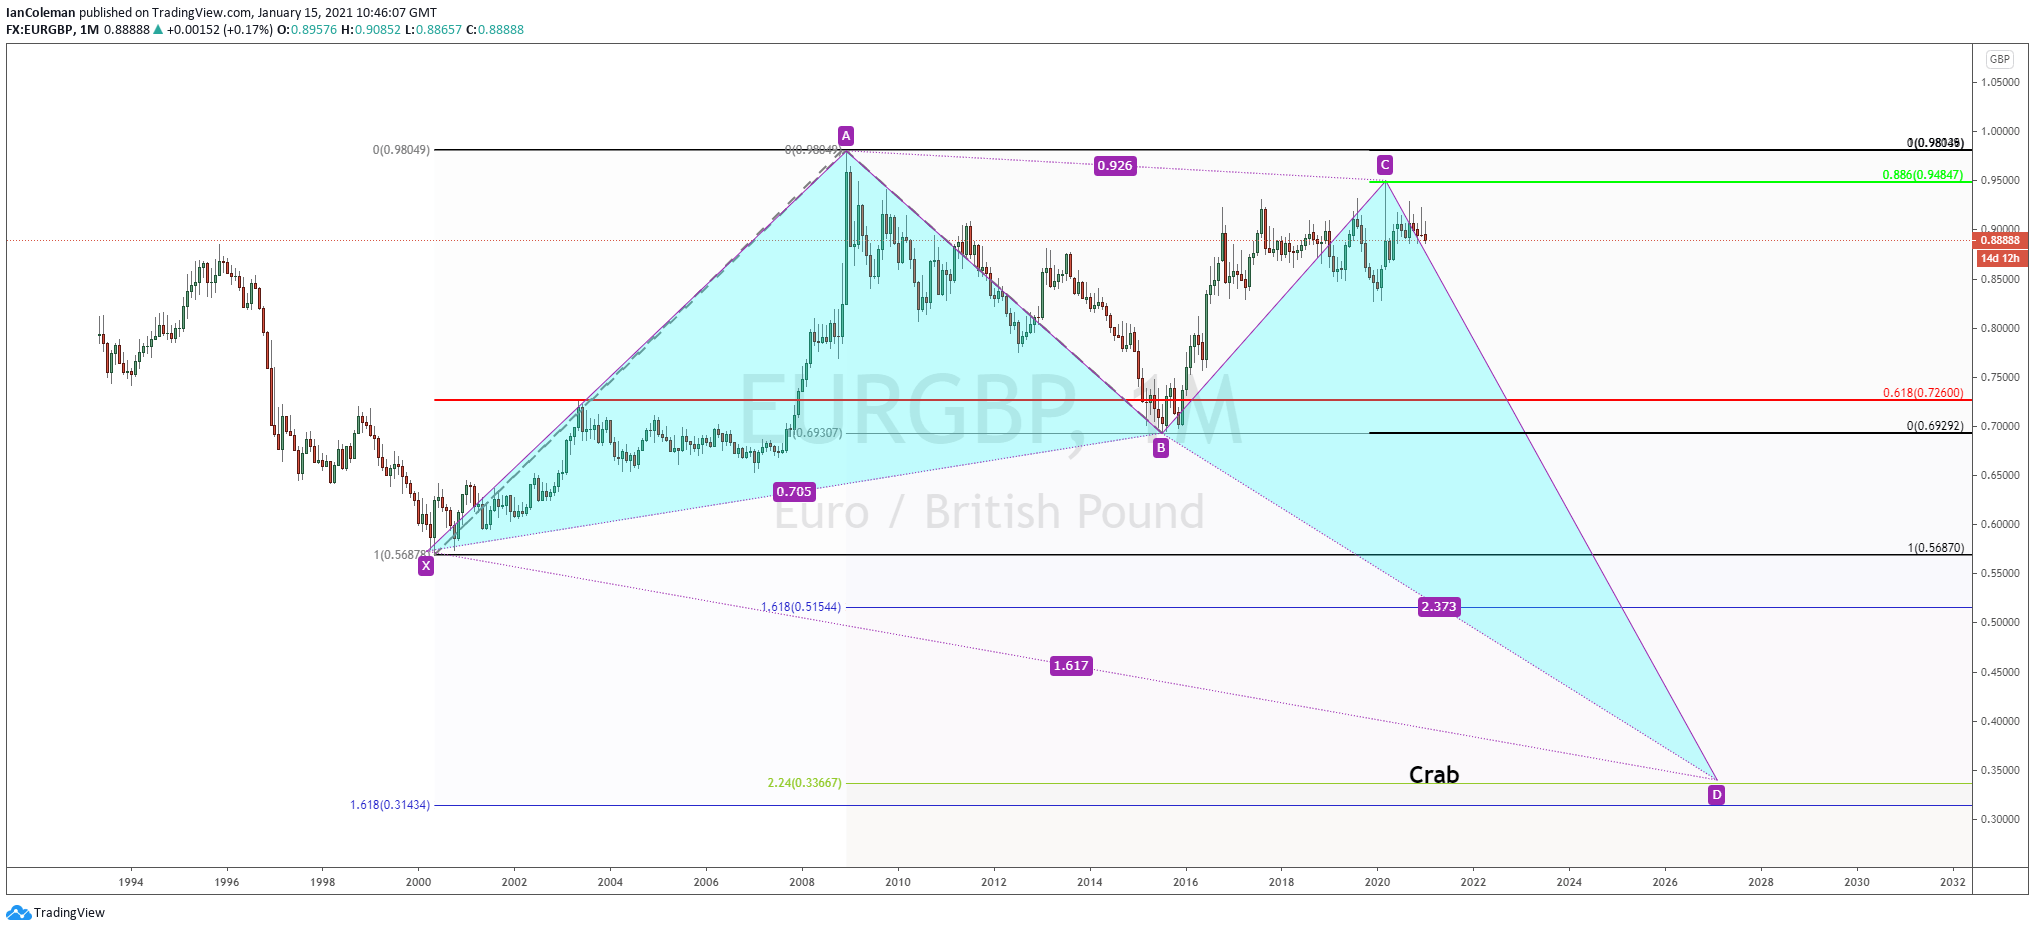
Let us keep our fingers crossed that this does not happen and look at the shorter timeframe setup.
EUR/GBP four-hours
We have a 261.8% extension level located at 0.8844. From an Elliott Wave perspective this could be the completion of a 5-wave bearish count suggesting that the next corrective wave (higher) should start soon.
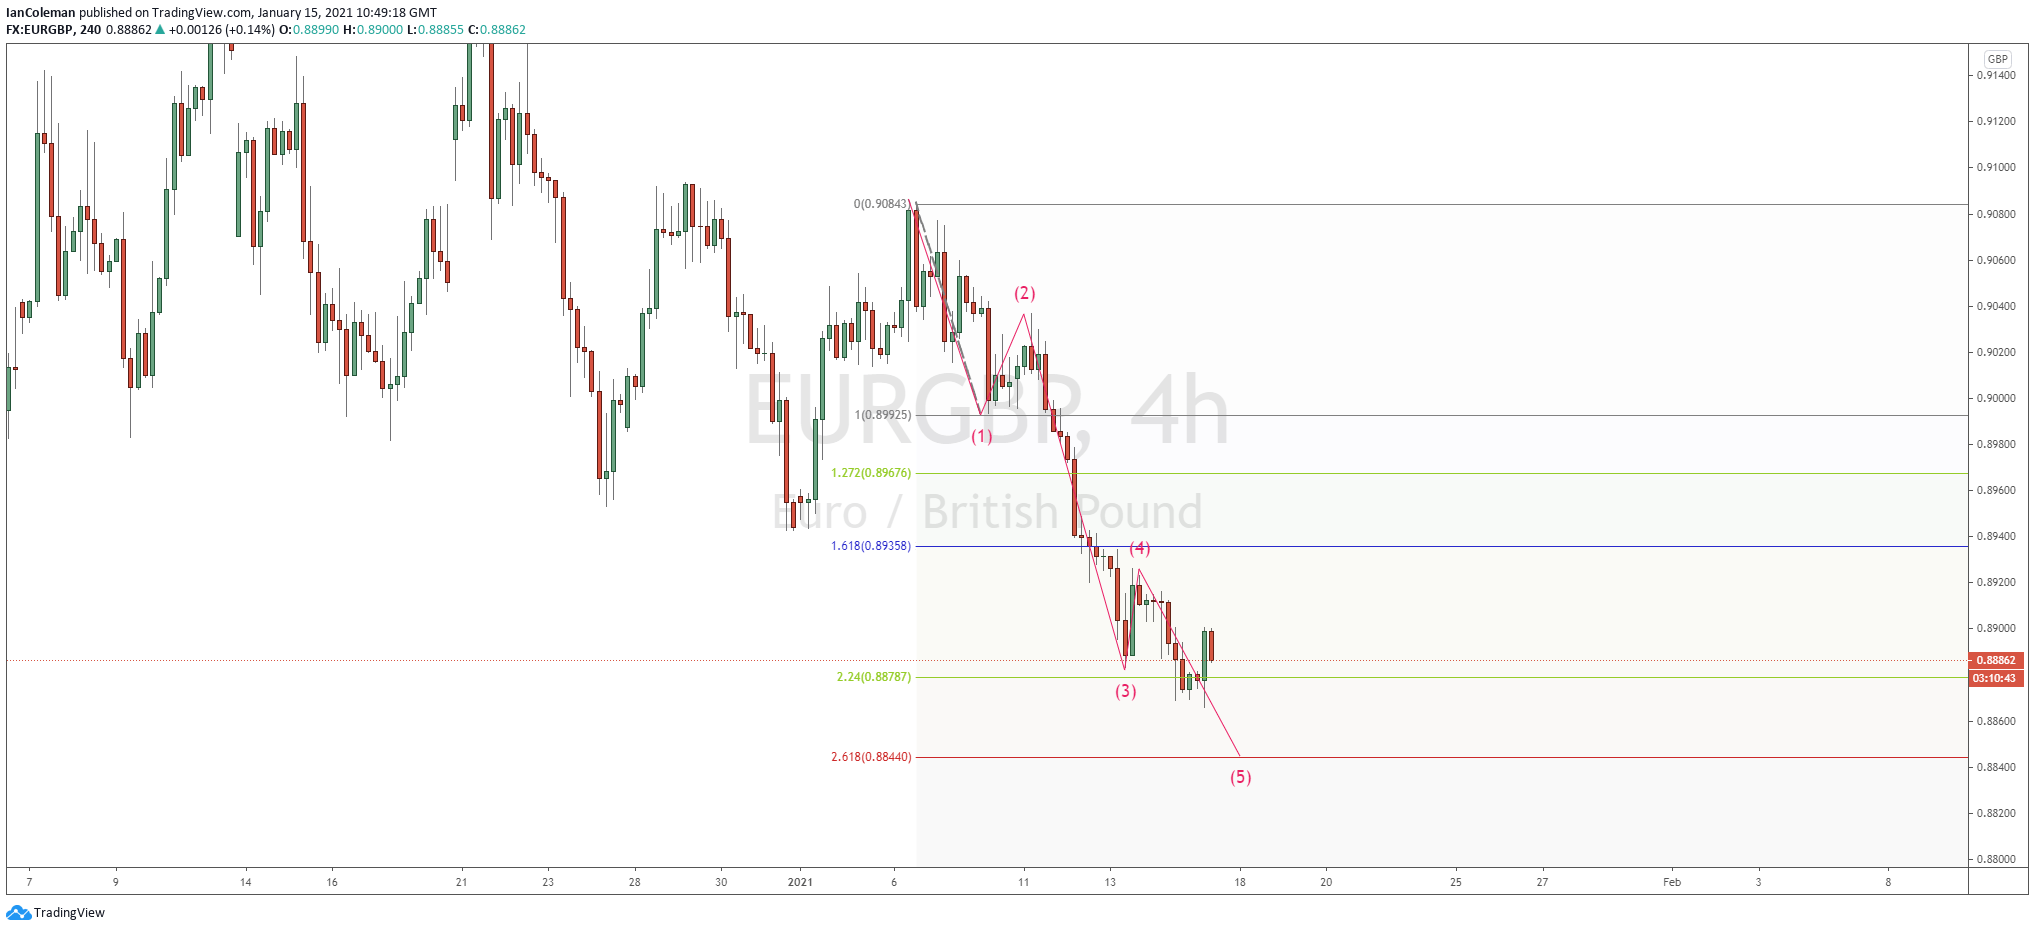
Correlation – Here we need to see a bias to BUY EURO against SELLING GBP.
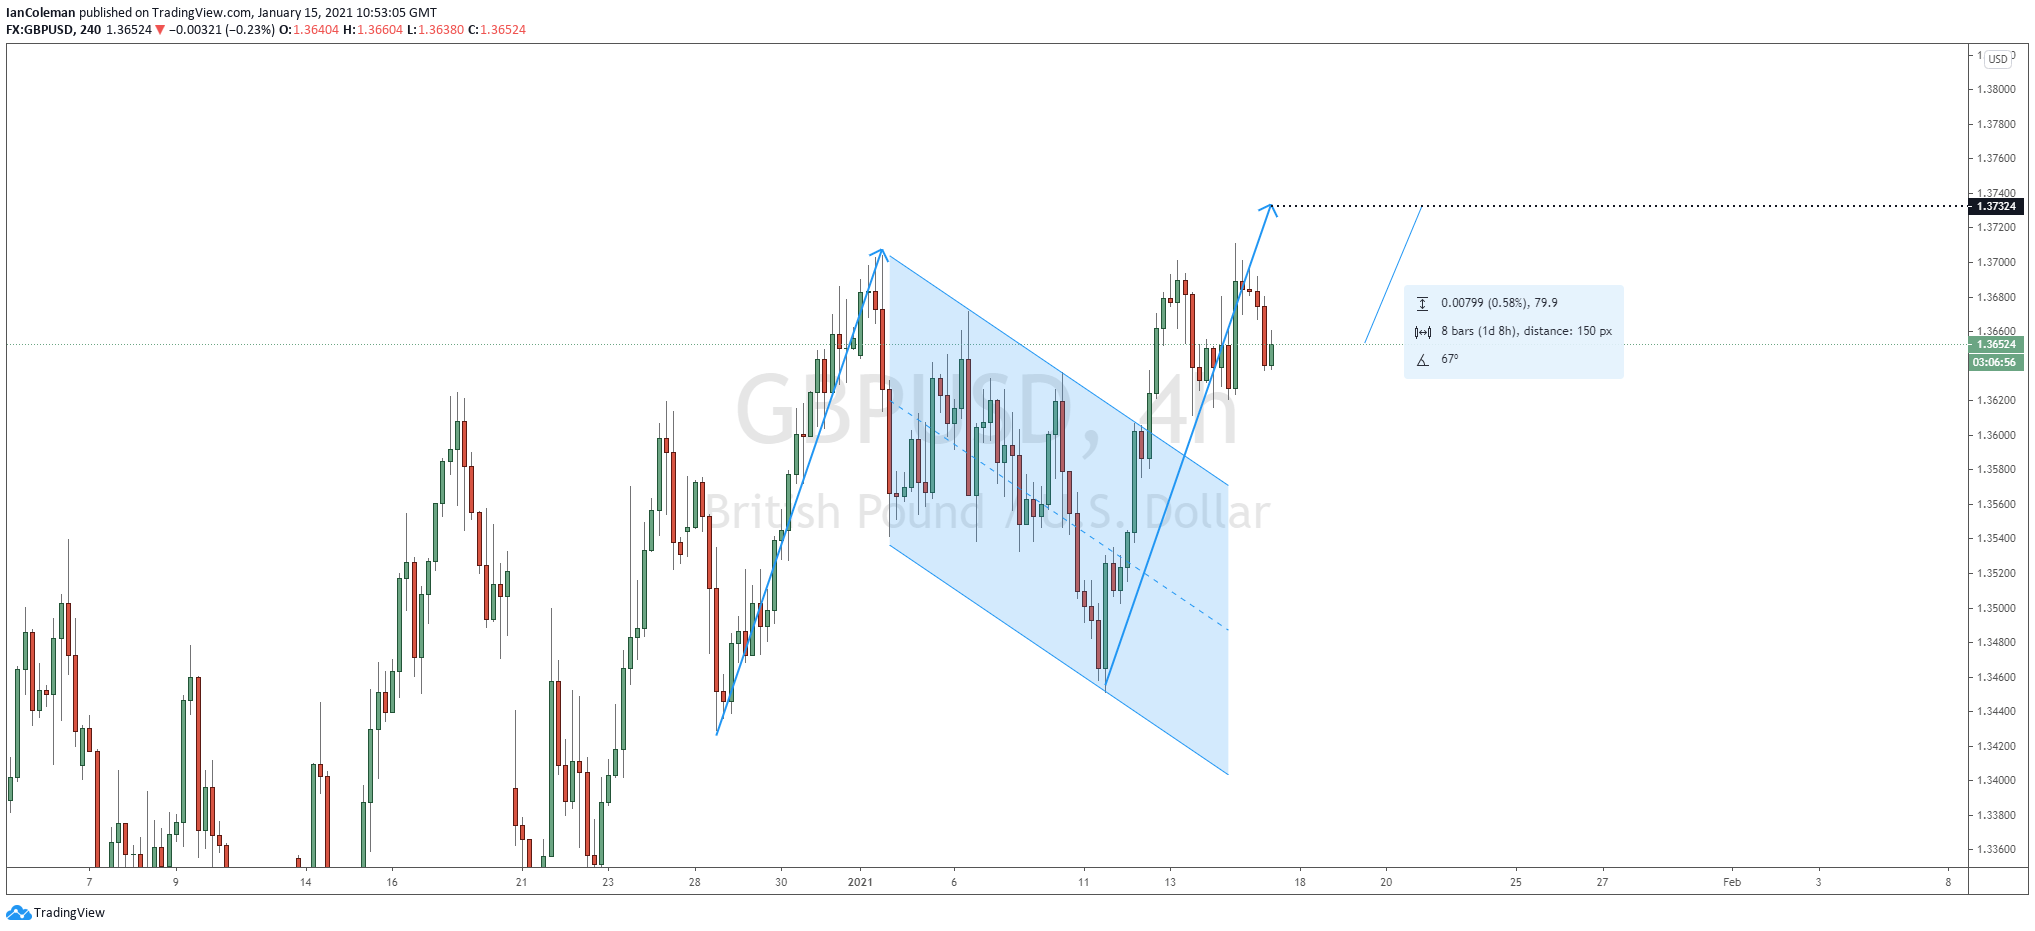
GBP/USD four-hours
Broken out of the flag formation to the upside. The measured move target for this pattern is seen at 1.3732. That is 80 pips from current price and more importantly, 0.58%.
EUR/USD four-hours
Broke out of the wedge formation to the downside. The pair achieved its measured move target of 1.2130. From an Elliott Wave perspective this could be the completion of a 5-wave bearish count suggesting that the next corrective wave (higher) should start soon. This should only be a short-term correction (giving the USD bias) but we could rally to the right shoulder at 1.2245. That is 0.99% from current price.
Correlation conclusion: So, using correlation, a correction on GBPUSD should be shorter (0.58%) than a correction higher in EURUSD (0.99%) giving EURGBP an upside bias.
I am watching the 261.8% extension closely. You may ask ‘why not buy EURUSD?’. The reason being that the long-term bias is still bearish and I prefer to ‘trade with the trend’.
Information on these pages contains forward-looking statements that involve risks and uncertainties. Markets and instruments profiled on this page are for informational purposes only and should not in any way come across as a recommendation to buy or sell in these assets. You should do your own thorough research before making any investment decisions. FXStreet does not in any way guarantee that this information is free from mistakes, errors, or material misstatements. It also does not guarantee that this information is of a timely nature. Investing in Open Markets involves a great deal of risk, including the loss of all or a portion of your investment, as well as emotional distress. All risks, losses and costs associated with investing, including total loss of principal, are your responsibility. The views and opinions expressed in this article are those of the authors and do not necessarily reflect the official policy or position of FXStreet nor its advertisers. The author will not be held responsible for information that is found at the end of links posted on this page.
If not otherwise explicitly mentioned in the body of the article, at the time of writing, the author has no position in any stock mentioned in this article and no business relationship with any company mentioned. The author has not received compensation for writing this article, other than from FXStreet.
FXStreet and the author do not provide personalized recommendations. The author makes no representations as to the accuracy, completeness, or suitability of this information. FXStreet and the author will not be liable for any errors, omissions or any losses, injuries or damages arising from this information and its display or use. Errors and omissions excepted.
The author and FXStreet are not registered investment advisors and nothing in this article is intended to be investment advice.
Recommended Content
Editors’ Picks
AUD/USD hovers around 0.6500 amid light trading, ahead of US GDP
AUD/USD is trading close to 0.6500 in Asian trading on Thursday, lacking a clear directional impetus amid an Anzac Day holiday in Australia. Meanwhile, traders stay cautious due ti risk-aversion and ahead of the key US Q1 GDP release.
USD/JPY finds its highest bids since 1990, near 155.50
USD/JPY keeps breaking into its highest chart territory since June of 1990 early Thursday, testing 155.50 for the first time in 34 years as the Japanese Yen remains vulnerable, despite looming Japanese intervention risks. Focus shifts to Thursday's US GDP report and the BoJ decision on Friday.
Gold price lacks firm intraday direction, holds steady above $2,300 ahead of US data
Gold price remains confined in a narrow band for the second straight day on Thursday. Reduced Fed rate cut bets and a positive risk tone cap the upside for the commodity. Traders now await key US macro data before positioning for the near-term trajectory.
Injective price weakness persists despite over 5.9 million INJ tokens burned
Injective price is trading with a bearish bias, stuck in the lower section of the market range. The bearish outlook abounds despite the network's deflationary efforts to pump the price. Coupled with broader market gloom, INJ token’s doomed days may not be over yet.
Meta Platforms Earnings: META sinks 10% on lower Q2 revenue guidance Premium
This must be "opposites" week. While Doppelganger Tesla rode horrible misses on Tuesday to a double-digit rally, Meta Platforms produced impressive beats above Wall Street consensus after the close on Wednesday, only to watch the share price collapse by nearly 10%.