EUR/AUD and EUR/NZD pairs show short-term bull setup

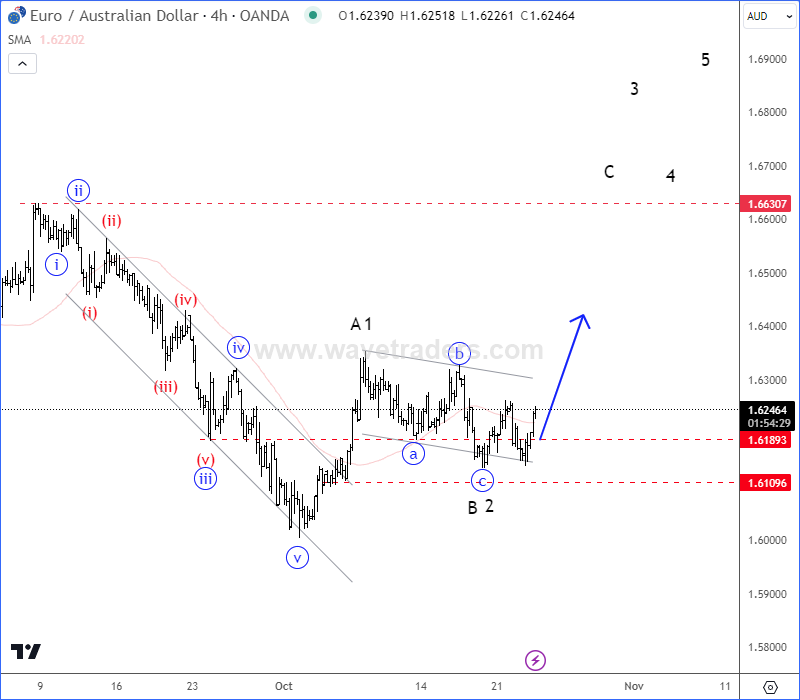
EUR/AUD is recovering, so for now we are observing a minimum three-wave A/1-B/2-C/3 rally away from that 1,6, with more upside potential in weeks ahead, up to 1,66 area after wave B/2 pullback.
It may actually have a completed an a-b-c pullback within wave B/2 in the 4-hour chart, so be aware of a continuation higher within wave C or 3, at least up to 1,6630 area.
EUR/AUD four-hour chart
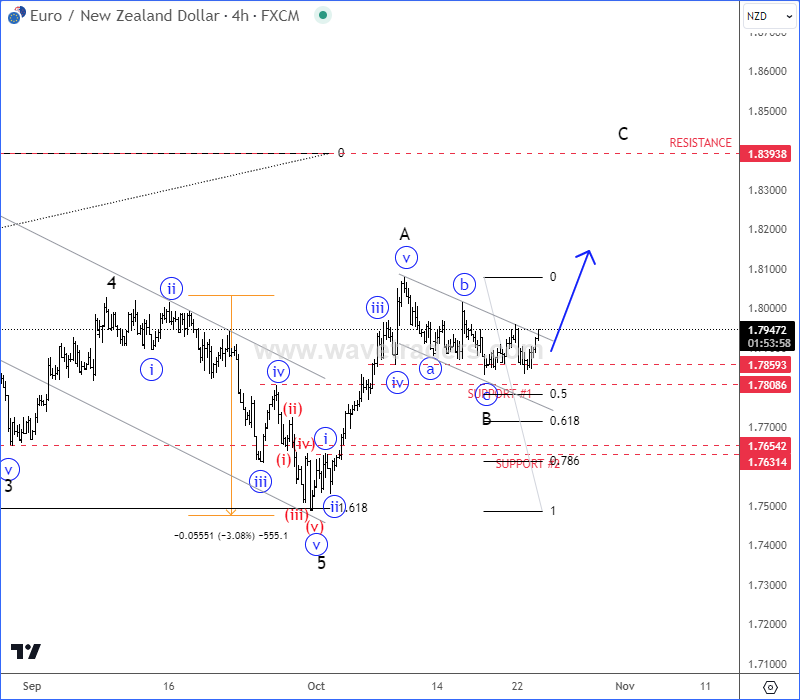
EUR/NZD four-hour chart
EUR/NZD made an impulsive drop from the beginning of August till end of September, so more weakness is expected, but after a three-wave A-B-C corrective recovery that can retest 1,83 - 1,84 resistance area.
It seems to have a completed projected a-b-c corrective setback in wave B at first 1,78x support area, so watch out for a continuation higher within wave C towards 1,83 – 1,84 resistance zone.
Get Full Access To Our Premium Elliott Wave Analysis For 14 Days. Click here.
Get Full Access To Our Premium Elliott Wave Analysis For 14 Days. Click here.
Author

Gregor Horvat
Wavetraders
Experience Grega is based in Slovenia and has been in the Forex market since 2003.


