Equities report: Fed interest rate decision due today

The upward movement of US equities seems to have been halted for now. In today’s report we are to have another look at the upcoming Fed decision and the recent updates on the US trade talks. From a technical point of view, we are to provide an analysis of S&P 500’s daily chart.
Fed decision day
The Fed’s interest rate decision is set to occur during today’s American session. The majority of market participants are currently anticipating the bank to remain on hold, with FFF currently implying a 98.8% probability for such a possibility to occur. Therefore, our attention turns to the bank's accompanying statement and Fed Chair Powell's press conference which is set to occur following the banks decision. In our view, given the heightened geopolitical risks and in particular the recent war between Israel and Iran which risks disrupting the global oil supply and in addition to the ongoing trade ambitions of the US Government, the uncertainty surrounding the global economy may have risen. In turn, the potential upside risks to the global economy and that of the US, may increase pressure on the Fed to opt to refrain from committing to rate cuts in the near future. In turn this could weigh on the US Equities markets, as the relatively tight financial conditions may remain place. However, should the bank's accompanying statement imply that the bank may cut rates in the near future, it may aid the US Equities markets. In conclusion, should the bank’s accompanying statement and Fed Chair Powell’s be perceived as hawkish in nature, it could weigh on the US Equities markets and vice versa.
Trade deals are still being discussed between the US and its partners
According to a report by Reuters, President Trump stated that Japan was being “tough” in trade talks and that the EU had yet to offer a deal which was considered to be fair and that the EU would need to offer “a good deal” or face higher tariffs. Moreover per POLITICO EU Chief Spokesperson Pinho stated that “Our clear preference is a negotiated, balanced, and mutually beneficial outcome. However, if a satisfactory agreement cannot be reached, all instruments and options will remain on the table” which may tend to imply that negotiations are relatively tough and thus an agreement by the July 9th deadline. On the other hand, the US and the UK have signed an agreement on Monday which would lower some tariffs on imports from the UK whilst the two continue their negotiations towards a formal trade deal. Furthermore, per the NYP US Treasury Secretary Scot Bessent will be meeting with his Chinese counterparts in approximately three weeks to discuss more on trade. Nonetheless, given the erratic behaviour by the US in regards to trade deals, should an apparent lack of progress emerge on reaching trade agreements with major trading partners such as the EU and China it could weigh on the US Equities market. Therefore, the possible meeting between US Treasury Scott Bessent and his counterparts may be closely monitored, as a failure to progress forward may lead to a resurgence of market worries about the state of the global economy.
Technical analysis
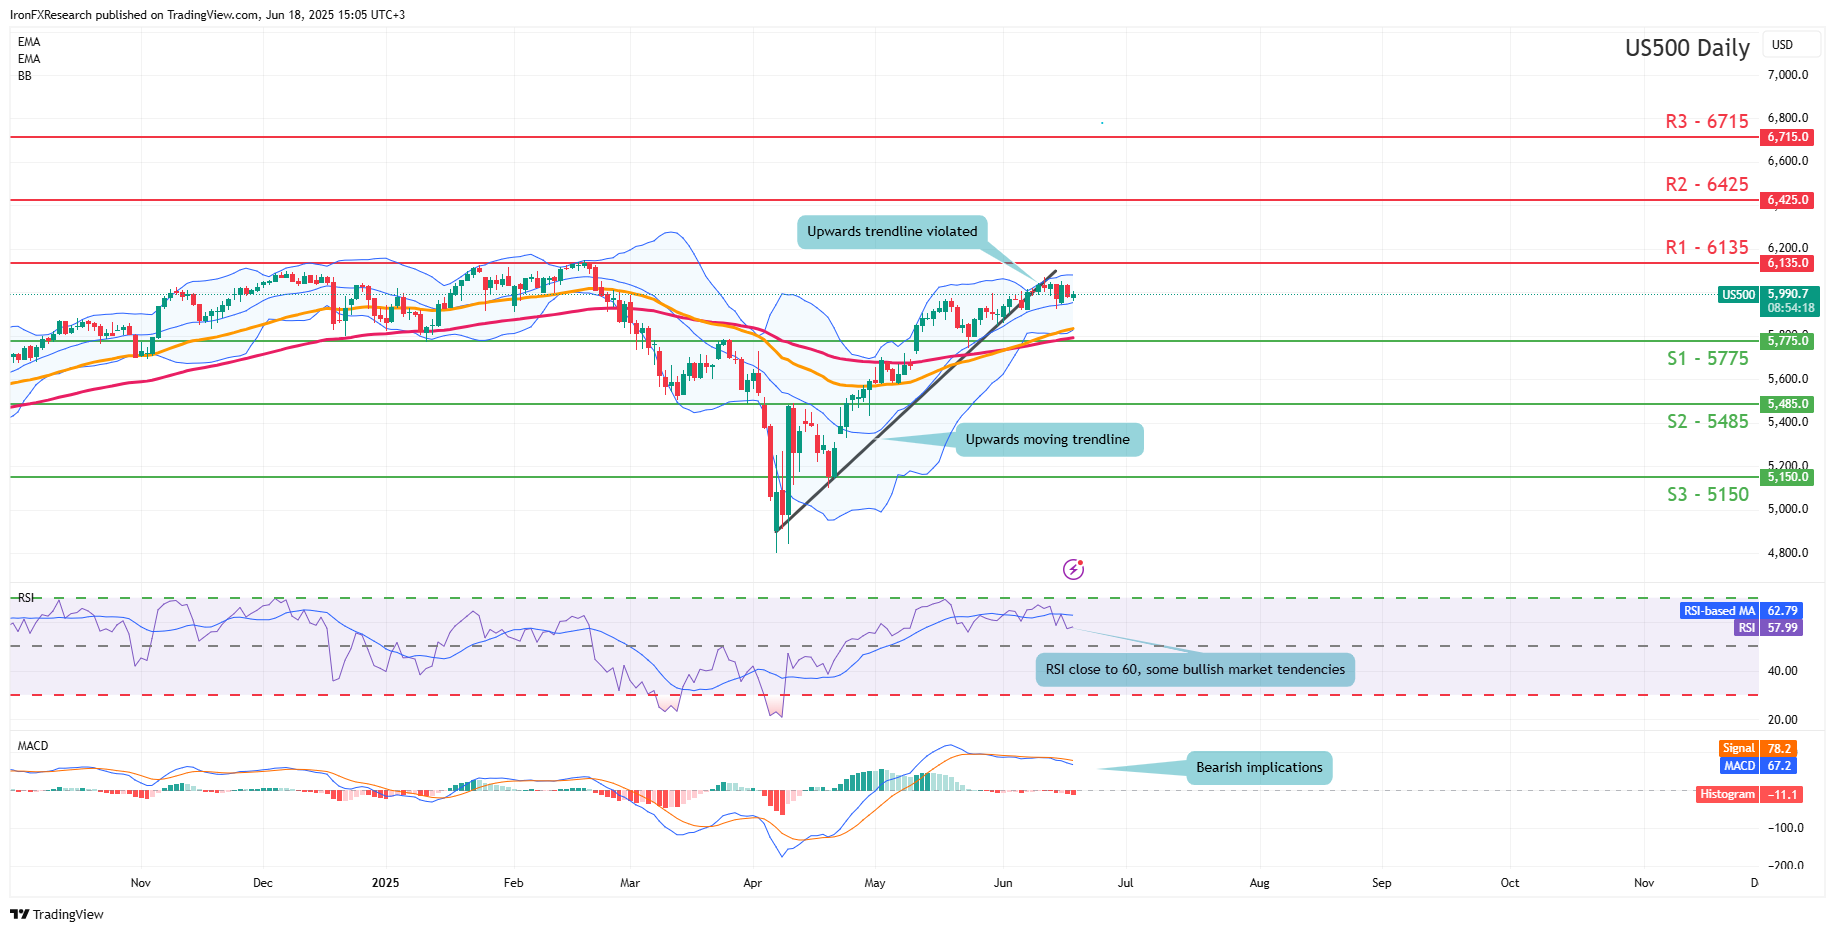
US500 daily chart
- Support: 5775 (S1), 5485 (S2), 5150 (S3).
- Resistance: 6135 (R1), 6425 (R2), 6715 (R3).
S&P 500 appears to be moving in a sideways fashion. We opt for a sideways bias and supporting our case is the index’s clear break below our upwards moving trendline. However, the RSI indicator below our chart still currently registers a figure near 60, which tends to imply a bullish market sentiment, yet the indicators decline below the 60 figure could also imply that the bullish momentum may be losing some steam. Nonetheless, for our sideways bias to be maintained, we would require the index to remain confined between our 5775 (S1) support level and the 6135 (R1) resistance line. On the other hand, for a bullish outlook we would require a clear break above the 6135 (R1) resistance line, with the next possible target for the bulls being the 6425 (R2) resistance level. Lastly, for a bearish outlook we would require a clear break below our 5775 (S1) support level, with the next possible target for the bears being the 5485 (S2) support line.
Author

Phaedros Pantelides
IronFX
Mr Pantelides has graduated from the University of Reading with a degree in BSc Business Economics, where he discovered his passion for trading and analyzing global geopolitics.


