|

Elliott Wave View: S&P 500 (SPX) Testing 2018 High [Video]

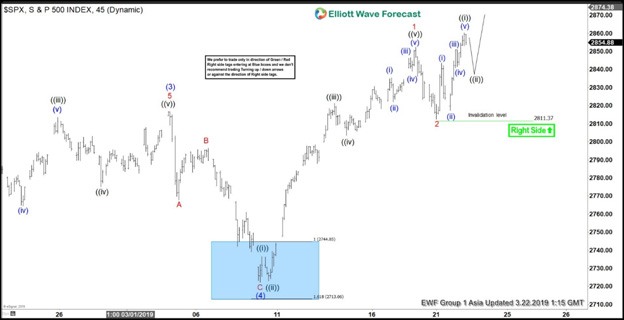
The rally from December 26, 2018 low in S&P 500 (SPX) remains in progress. We are labeling this rally as an impulse Elliott Wave structure, which is 5 waves structure. In the chart below, we can see wave (3) ended at 2816.88 and wave (4) ended at 2722.27. The internal of wave (4) unfolded as a zigzag Elliott Wave structure. Wave A of (4) ended at 2767.66, wave B of (4) ended at 2796.44, and wave C of (4) ended at 2722.27. Wave (4) pullback ended at our blue box inflection area where wave C = wave A. This blue box area is a high frequency area where both buyers and sellers agree in direction of the next move for 3 waves at least. Anyone who bought the dips at the blue box should now have a risk free trade where stop is at break even level.

The Index is currently in the last wave (5) rally which subdivides in 5 waves of lesser degree. Up from 2722.27, wave 1 ended at 2852.42 and wave 2 ended at 2811.37. Near term, while pullback stays above 2811.37, and more importantly above 2722.27, expect the Index to extend higher. Shorter cycle trend and momentum still points higher and we expect Index to find support in the dips in 3, 7, or 11 swing.

1 Hour SPX Elliott Wave Chart

SPX

SPX Video of The Day


Become a Successful Trader and Master Elliott Wave like a Pro. Start your Free 14 Day Trial at - Elliott Wave Forecast.

Author

Elliott Wave Forecast Team

Elliott Wave Forecast Team

ElliottWave-Forecast.com

More from Elliott Wave Forecast Team
Share:

Editor's Picks

EUR/USD: US Dollar to remain pressured until uncertainty fog dissipates

Unimpressive European Central Bank left monetary policy unchanged for the fifth consecutive meeting. The United States first-tier employment and inflation data is scheduled for the second week of February. EUR/USD battles to remain afloat above 1.1800, sellers moving to the sidelines.

GBP/USD reclaims 1.3600 and above

GBP/USD reverses two straight days of losses, surpassing the key 1.3600 yardstick on Friday. Cable’s rebound comes as the Greenback slips away from two-week highs in response to some profit-taking mood and speculation of Fed rate cuts. In addition, hawkish comments from the BoE’s Pill are also collaborating with the quid’s improvement.

Gold: Volatility persists in commodity space

After losing more than 8% to end the previous week, Gold remained under heavy selling pressure on Monday and dropped toward $4,400. Although XAU/USD staged a decisive rebound afterward, it failed to stabilize above $5,000. The US economic calendar will feature Nonfarm Payrolls and Consumer Price Index data for January, which could influence the market pricing of the Federal Reserve’s policy outlook and impact Gold’s performance.

Week ahead: US NFP and CPI data to shake Fed cut bets, Japan election looms

US NFP and CPI data awaited after Warsh’s nomination as Fed chief. Yen traders lock gaze on Sunday’s snap election. UK and Eurozone Q4 GDP data also on the agenda. China CPI and PPI could reveal more weakness in domestic demand.

Three scenarios for Japanese Yen ahead of snap election

The latest polls point to a dominant win for the ruling bloc at the upcoming Japanese snap election. The larger Sanae Takaichi’s mandate, the more investors fear faster implementation of tax cuts and spending plans. 

XRP rally extends as modest ETF inflows support recovery

Ripple is accelerating its recovery, trading above $1.36 at the time of writing on Friday, as investors adjust their positions following a turbulent week in the broader crypto market. The remittance token is up over 21% from its intraday low of $1.12.