|

Elliott Wave View: Chesapeake Energy (CHK) Should See More Downside [Video]

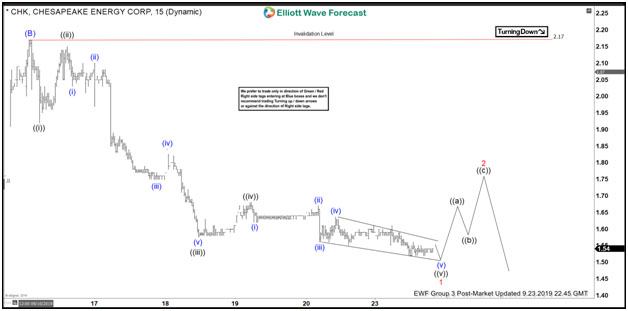
Elliott Wave view on Chesapeake Energy Corp (ticker symbol: CHK) suggests the rally to 2.17 ended wave (B). This suggests the stock has turned lower in wave (C) and can break below August 7 low (1.26). The stock however needs to break below 1.26 to confirm the bearish view and avoid a double correction in wave (B).

Down from September 16, 2019 high (2.17), wave ((i)) ended at 1.92 and wave ((ii)) ended at 2.15. The stock then extends lower with separation in wave ((iii)) towards 1.58 and wave ((iv)) bounce ended at 1.68. Internal of wave ((iii)) subdivided into another impulse in lesser degree.

Wave ((v)) is currently in progress as a diagonal and expected to complete soon. The 5 waves impulsive move lower should complete wave 1 in higher degree. The stock should then bounce in wave 2 to correct cycle from Sept 16 high (2.17) before the decline resumes. Bounce should find sellers in the sequence of 3, 7, or 11 swing for further downside as far as pivot at 2.17 high stays intact. Assuming the stock can break below 1.26 in the next move lower, potential target to the downside is 61.8 – 76.4 fibonacci extension of wave (A)-(B) towards as low as 0.39 – 0.73.

CHK 1 Hour Elliott Wave Chart

CHK

CHK 1 Hour Elliott Wave Video

Author

Elliott Wave Forecast Team

Elliott Wave Forecast Team

ElliottWave-Forecast.com

More from Elliott Wave Forecast Team
Share:

Editor's Picks

EUR/USD stays weak near 1.1650 ahead of critical US data

EUR/USD stays on the back foot and trades at around 1.1650 on Friday. The pair remains undermined by broad US Dollar strength and a cautious market mood. Traders keenly await the US Nonfarm Payrolls data and Supreme Court's ruling on Trump's tariff powers for further direction. 

GBP/USD drops toward 1.3400 as focus shifts to US employment report

GBP/USD remains under bearish pressure after posting losses for three consecutive days and declines toward 1.3400. The US Dollar stays resilient against its rivals and doesn't allow the pair to stage a rebound as market participants await December employment data from the US.

Gold flat lines below $4,500, looks to US NFP report for fresh impetus

Gold reverses a modest intraday dip to the $4,453 area, and trades near the top end of its daily range at around $4,470. The upside, however, seems limited as traders stay on the sidelines while waiting for the US Nonfarm Payrolls report later today. The crucial employment details will be looked upon for more cues about the Federal Reserve's rate-cut path.

Nonfarm Payrolls expected to show US labor market remained weak in December

The United States Bureau of Labor Statistics will release the Nonfarm Payrolls data for December on Friday at 13:30 GMT. Economists expect Nonfarm Payrolls to rise by 60,000 in December following the 64,000 increase recorded in November.

2026 economic outlook: Clear skies but don’t unfasten your seatbelts yet

Most years fade into the background as soon as a new one starts. Not 2025: a year of epochal shifts, in which the macroeconomy was the dog that did not bark. What to expect in 2026? The shocks of 2025 will not be undone, but neither will they be repeated.

Pepe Price Forecast: PEPE risks 100-day EMA fallout as bullish interest fades

Pepe is under extreme selling pressure, trading in the red for the fifth consecutive day, down 1% at press time on Friday. Pepe’s decline following a 72% hike last week suggests a likely profit-booking phase, while on-chain data indicates declining network activity.