|

Elliott Wave Structure Suggests XLE Topping Soon

XLE Topping Soon

Taking a look at the recent Elliott wave structure in XLE suggests a top may be near. Starting from the 12/24/18 low at $53.25 the energy ETF shows a 5 wave impulse in wave (A) to $66.93 on 2/20/19. From there we count a 3 wave correction to the (B) wave low at $63.31 on 3/8/19. So we see 5 waves up followed by 3 back. This sequence gives a clue for practitioners of Elliott wave on what to expect next. The most likely structure playing out is that of a zigzag. This pattern is characterized by the 5-3-5 structure within its subwaves.

It is the structure from this (B) wave low that we are giving the most attention. The overlapping nature of the price action from $63.31 suggest an ending diagonal wave (C). In an ending diagonal we need 5 overlapping waves before completion. Since we only count 3 waves from the 3/8/19 low the structure has yet to be confirmed.

XLE ZigZag

XLE

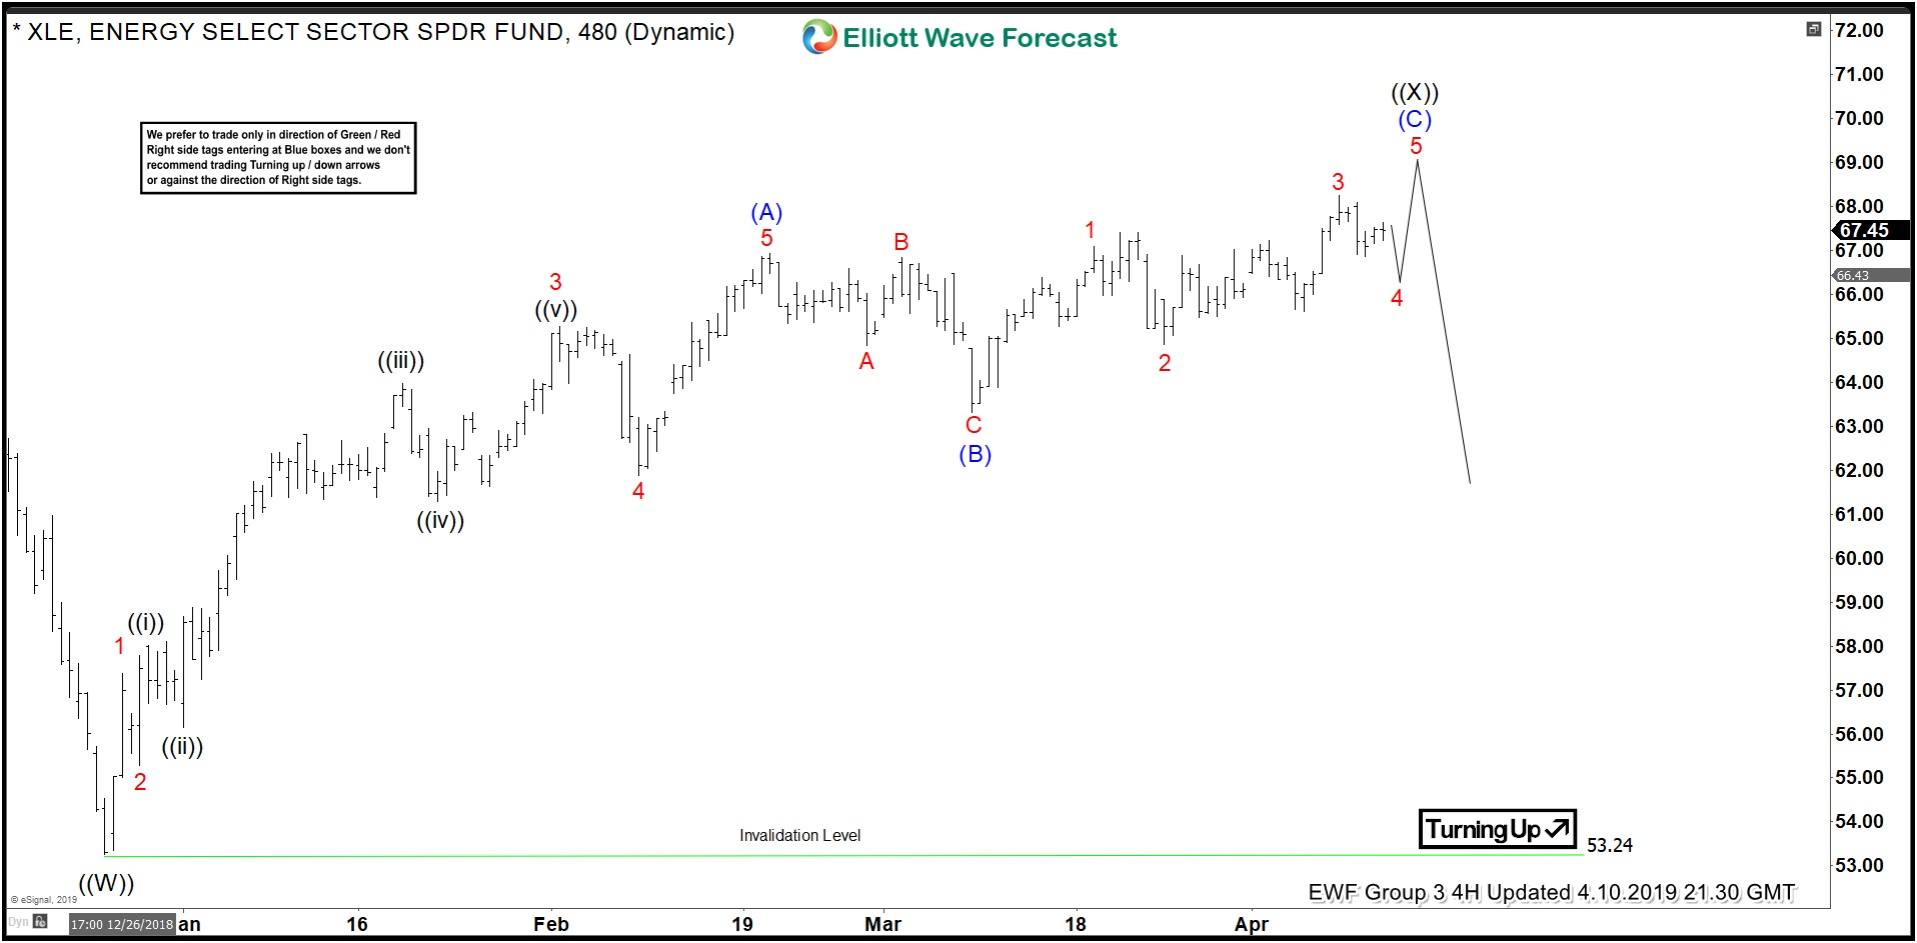
XLE 4 Hour Bar Chart From December 24, 2018 Low

A Closer Look

Waves 1, 2, and 3 of the ending diagonal are complete and now we look for wave 4 to end above the wave 2 $64.87 low of 3/25/19. Looking at the chart below we look for wave 4 to end with one more push lower above $64.87 before turning higher for wave 5. This will be confirmed by moving above wave 3’s 4/8/19 high, $68.25. Consequently a push below $64.87 before the new high would suggest that the entire cycle from the 12/24/18 lows has ended. Let’s see how this plays out over the coming sessions.

XLE

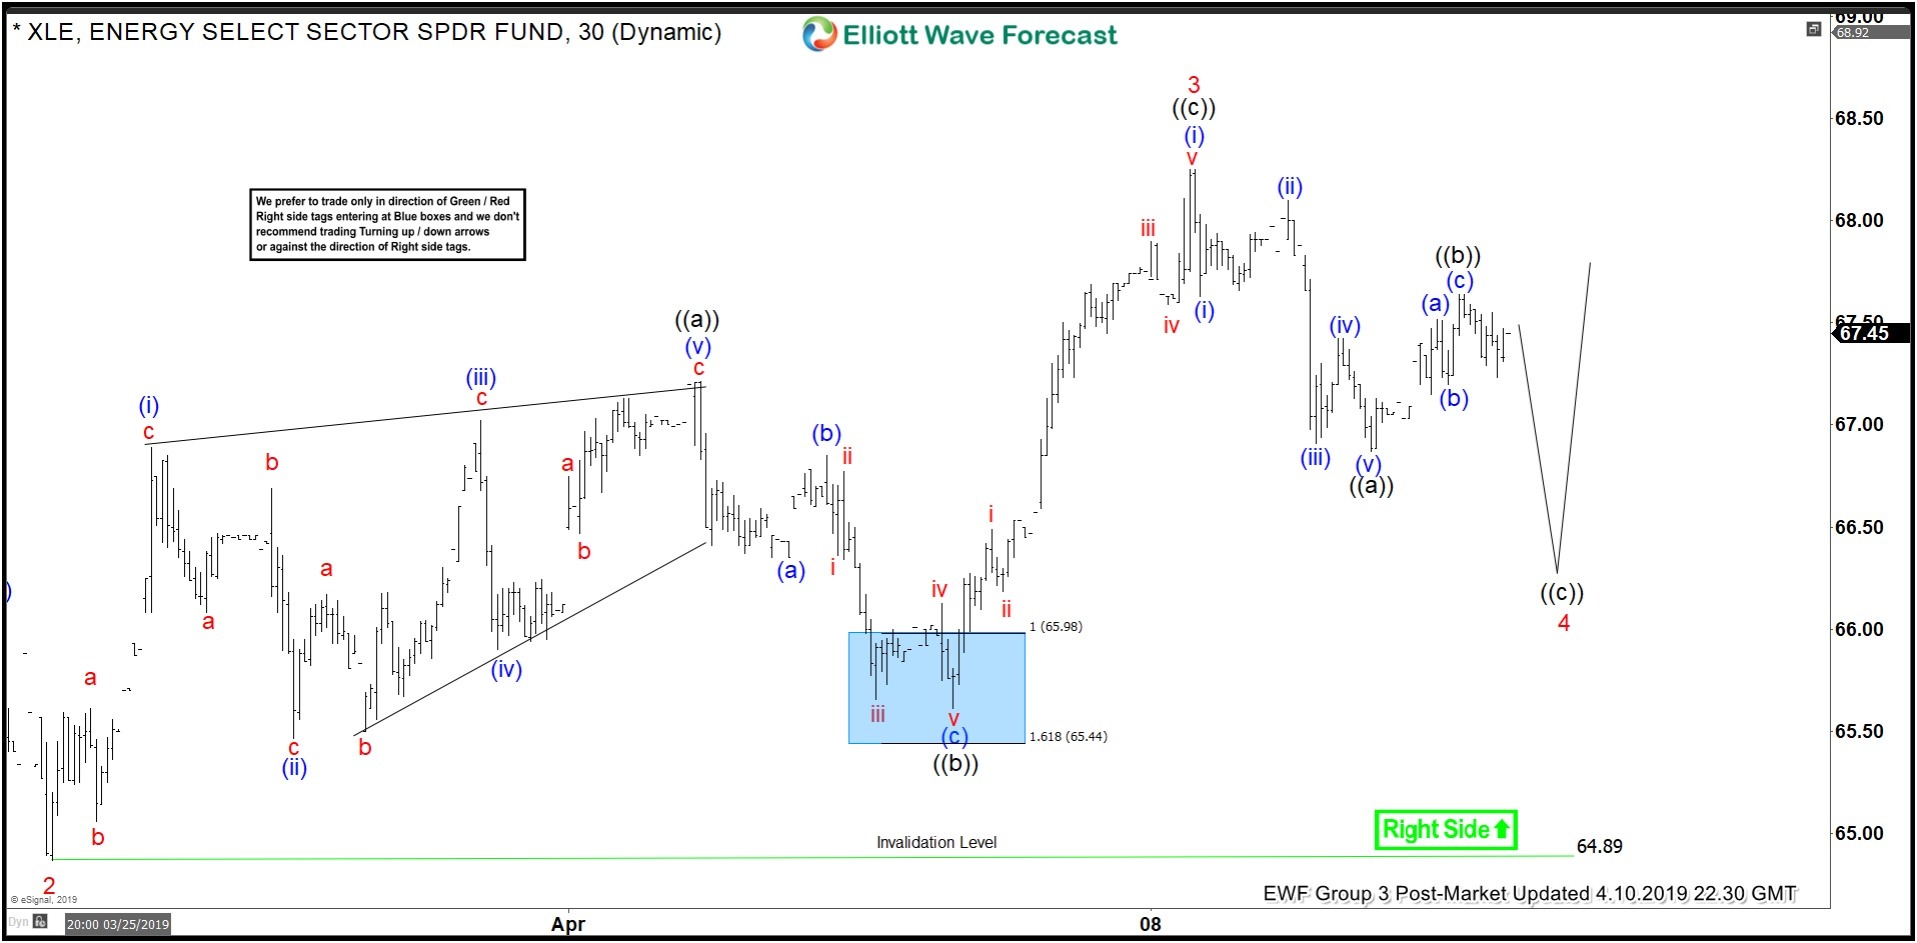
XLE 1 Hour Bar Chart 4/10/2019

Come experience how these Elliott wave structures evolve as we map 78 different financial instruments throughout the day.


Become a Successful Trader and Master Elliott Wave like a Pro. Start your Free 14 Day Trial at - Elliott Wave Forecast.

Author

Elliott Wave Forecast Team

Elliott Wave Forecast Team

ElliottWave-Forecast.com

More from Elliott Wave Forecast Team
Share:

Editor's Picks

EUR/USD: US Dollar to remain pressured until uncertainty fog dissipates

Unimpressive European Central Bank left monetary policy unchanged for the fifth consecutive meeting. The United States first-tier employment and inflation data is scheduled for the second week of February. EUR/USD battles to remain afloat above 1.1800, sellers moving to the sidelines.

GBP/USD reclaims 1.3600 and above

GBP/USD reverses two straight days of losses, surpassing the key 1.3600 yardstick on Friday. Cable’s rebound comes as the Greenback slips away from two-week highs in response to some profit-taking mood and speculation of Fed rate cuts. In addition, hawkish comments from the BoE’s Pill are also collaborating with the quid’s improvement.

Gold: Volatility persists in commodity space

After losing more than 8% to end the previous week, Gold remained under heavy selling pressure on Monday and dropped toward $4,400. Although XAU/USD staged a decisive rebound afterward, it failed to stabilize above $5,000. The US economic calendar will feature Nonfarm Payrolls and Consumer Price Index data for January, which could influence the market pricing of the Federal Reserve’s policy outlook and impact Gold’s performance.

Week ahead: US NFP and CPI data to shake Fed cut bets, Japan election looms

US NFP and CPI data awaited after Warsh’s nomination as Fed chief. Yen traders lock gaze on Sunday’s snap election. UK and Eurozone Q4 GDP data also on the agenda. China CPI and PPI could reveal more weakness in domestic demand.

Three scenarios for Japanese Yen ahead of snap election

The latest polls point to a dominant win for the ruling bloc at the upcoming Japanese snap election. The larger Sanae Takaichi’s mandate, the more investors fear faster implementation of tax cuts and spending plans. 

XRP rally extends as modest ETF inflows support recovery

Ripple is accelerating its recovery, trading above $1.36 at the time of writing on Friday, as investors adjust their positions following a turbulent week in the broader crypto market. The remittance token is up over 21% from its intraday low of $1.12.